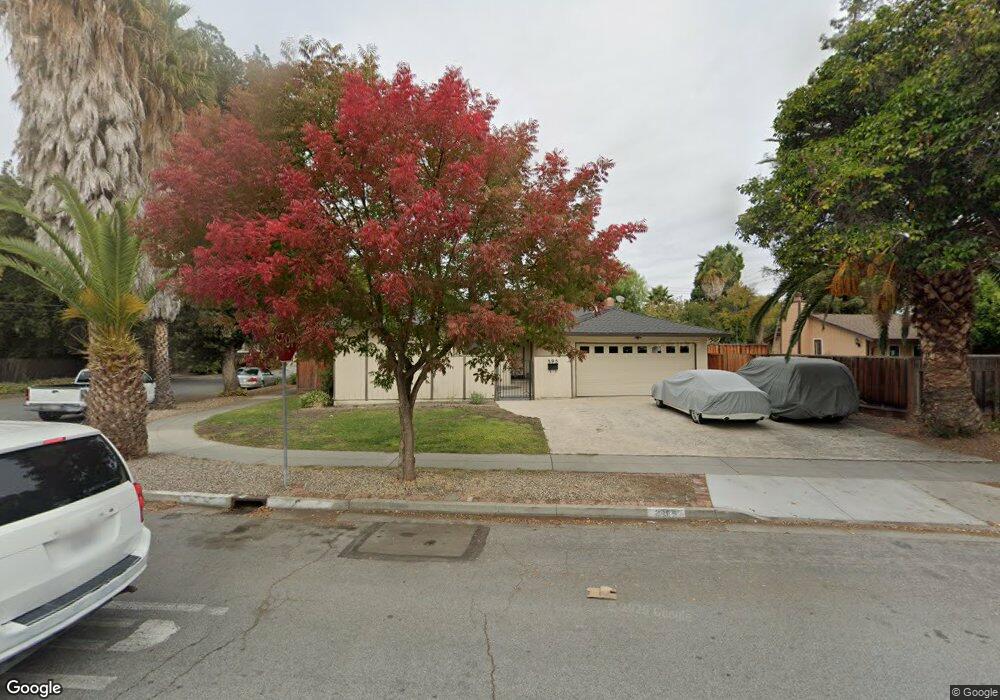
395 Conestoga Way San Jose, CA 95123
Oak Ridge NeighborhoodEstimated Value: $1,601,699 - $1,702,000
4
Beds
2
Baths
1,826
Sq Ft
$900/Sq Ft
Est. Value
About This Home
This home is located at 395 Conestoga Way, San Jose, CA 95123 and is currently estimated at $1,643,675, approximately $900 per square foot. 395 Conestoga Way is a home located in Santa Clara County with nearby schools including Oak Ridge Elementary School, Herman (Leonard) Intermediate School, and Santa Teresa High School.
Ownership History
Date
Name
Owned For
Owner Type
Purchase Details
Closed on
Nov 3, 2016
Sold by
Ruelas Estela Neri
Bought by
Ruelas Estela
Current Estimated Value
Home Financials for this Owner
Home Financials are based on the most recent Mortgage that was taken out on this home.
Original Mortgage
$336,000
Outstanding Balance
$269,750
Interest Rate
3.42%
Mortgage Type
New Conventional
Estimated Equity
$1,373,925
Purchase Details
Closed on
Dec 11, 2015
Sold by
Neri Jorge
Bought by
Ruellas Estela Neri and Neri Estela
Purchase Details
Closed on
Jun 4, 2001
Sold by
Davis Gerald C and Davis Jean C
Bought by
Neri Jorge and Neri Estela
Home Financials for this Owner
Home Financials are based on the most recent Mortgage that was taken out on this home.
Original Mortgage
$377,600
Interest Rate
6.55%
Purchase Details
Closed on
Feb 5, 1999
Sold by
Davis Gerald C and Davis Jean C
Bought by
Davis Gerald C and Davis Jean C
Create a Home Valuation Report for This Property
The Home Valuation Report is an in-depth analysis detailing your home's value as well as a comparison with similar homes in the area
Home Values in the Area
Average Home Value in this Area
Purchase History
| Date | Buyer | Sale Price | Title Company |
|---|---|---|---|
| Ruelas Estela | -- | North American Title Co Inc | |
| Ruellas Estela Neri | -- | None Available | |
| Neri Jorge | $472,000 | North American Title Co | |
| Davis Gerald C | -- | -- |
Source: Public Records
Mortgage History
| Date | Status | Borrower | Loan Amount |
|---|---|---|---|
| Open | Ruelas Estela | $336,000 | |
| Closed | Neri Jorge | $377,600 |
Source: Public Records
Tax History Compared to Growth
Tax History
| Year | Tax Paid | Tax Assessment Tax Assessment Total Assessment is a certain percentage of the fair market value that is determined by local assessors to be the total taxable value of land and additions on the property. | Land | Improvement |
|---|---|---|---|---|
| 2025 | $10,122 | $710,831 | $319,742 | $391,089 |
| 2024 | $10,122 | $696,894 | $313,473 | $383,421 |
| 2023 | $9,958 | $683,230 | $307,327 | $375,903 |
| 2022 | $9,896 | $669,834 | $301,301 | $368,533 |
| 2021 | $9,741 | $656,701 | $295,394 | $361,307 |
| 2020 | $9,521 | $649,969 | $292,366 | $357,603 |
| 2019 | $9,296 | $637,226 | $286,634 | $350,592 |
| 2018 | $9,229 | $624,732 | $281,014 | $343,718 |
| 2017 | $9,103 | $612,483 | $275,504 | $336,979 |
| 2016 | $8,662 | $600,474 | $270,102 | $330,372 |
| 2015 | $8,464 | $591,455 | $266,045 | $325,410 |
| 2014 | $7,736 | $579,870 | $260,834 | $319,036 |
Source: Public Records
Map
Nearby Homes
- 6129 Glen Harbor Dr
- 5968 Sorrel Ave
- 5991 Sorrel Ave
- 379 Roan St
- 401 Henderson Dr
- 394 Bay St
- 6239 Mahan Dr
- 471 Tovar Dr
- 406 Madison Dr
- 5865 Paddon Cir
- 482 Calero Ave
- 579 Suisse Dr
- 497 Curie Dr
- 0 Deer Valley Rd Unit 225017975
- 6161 Iowa Dr
- 6298 Snell Ave
- 6273 Mountford Dr
- 5631 Herma St
- 5629 Judith St
- 6449 Curie Ct
- 393 Conestoga Way
- 5990 Dunn Ave
- 403 Conestoga Way
- 5984 Dunn Ave
- 402 Arabian St
- 5991 Bufkin Dr
- 398 Conestoga Way
- 5997 Bufkin Dr
- 5985 Bufkin Dr
- 405 Conestoga Way
- 394 Conestoga Way
- 402 Conestoga Way
- 5978 Dunn Ave
- 5977 Bufkin Dr
- 404 Arabian St
- 406 Conestoga Way
- 409 Conestoga Way
- 392 Conestoga Way
- 6036 Dunn Ave
- 5974 Dunn Ave