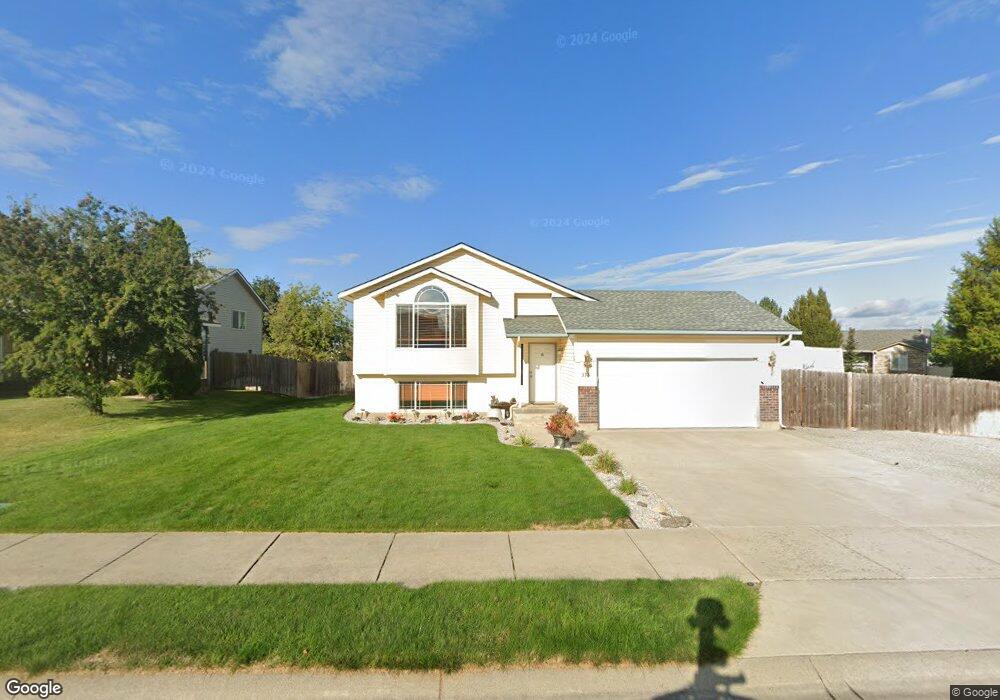
395 E Tiger Ave Post Falls, ID 83854
North Prairie NeighborhoodEstimated Value: $462,000 - $508,000
4
Beds
3
Baths
1,880
Sq Ft
$259/Sq Ft
Est. Value
About This Home
This home is located at 395 E Tiger Ave, Post Falls, ID 83854 and is currently estimated at $486,179, approximately $258 per square foot. 395 E Tiger Ave is a home located in Kootenai County with nearby schools including Mullan Trail Elementary School, Post Falls Middle School, and Post Falls High School.
Ownership History
Date
Name
Owned For
Owner Type
Purchase Details
Closed on
Dec 13, 2013
Sold by
Botai Bear Stella M and Bear Troy W
Bought by
Grider Owen Howard and Grider Janyce M
Current Estimated Value
Home Financials for this Owner
Home Financials are based on the most recent Mortgage that was taken out on this home.
Original Mortgage
$156,690
Outstanding Balance
$115,241
Interest Rate
4.04%
Mortgage Type
New Conventional
Estimated Equity
$370,938
Purchase Details
Closed on
Jul 27, 2012
Sold by
Viking Constrution Inc
Bought by
Grise Donald W and Grise Janet E
Purchase Details
Closed on
Jul 21, 2011
Sold by
Hague Brandi M
Bought by
Botai Bear Stella M and Bear Troy W
Home Financials for this Owner
Home Financials are based on the most recent Mortgage that was taken out on this home.
Original Mortgage
$125,242
Interest Rate
4.5%
Mortgage Type
FHA
Purchase Details
Closed on
Apr 5, 2006
Sold by
Weaver Mathew N
Bought by
Hague Bradi M
Create a Home Valuation Report for This Property
The Home Valuation Report is an in-depth analysis detailing your home's value as well as a comparison with similar homes in the area
Home Values in the Area
Average Home Value in this Area
Purchase History
| Date | Buyer | Sale Price | Title Company |
|---|---|---|---|
| Grider Owen Howard | -- | Kootenai County Title Co | |
| Grise Donald W | -- | North Idaho Title Co | |
| Botai Bear Stella M | -- | -- | |
| Hague Bradi M | -- | -- |
Source: Public Records
Mortgage History
| Date | Status | Borrower | Loan Amount |
|---|---|---|---|
| Open | Grider Owen Howard | $156,690 | |
| Previous Owner | Botai Bear Stella M | $125,242 |
Source: Public Records
Tax History
| Year | Tax Paid | Tax Assessment Tax Assessment Total Assessment is a certain percentage of the fair market value that is determined by local assessors to be the total taxable value of land and additions on the property. | Land | Improvement |
|---|---|---|---|---|
| 2025 | $1,772 | $452,400 | $175,000 | $277,400 |
| 2024 | $1,713 | $430,550 | $152,000 | $278,550 |
| 2023 | $1,713 | $460,834 | $160,000 | $300,834 |
| 2022 | $2,275 | $491,760 | $157,500 | $334,260 |
| 2021 | $1,916 | $311,660 | $105,000 | $206,660 |
| 2020 | $1,998 | $272,810 | $90,000 | $182,810 |
| 2019 | $1,692 | $230,950 | $90,000 | $140,950 |
| 2018 | $1,430 | $198,550 | $70,000 | $128,550 |
| 2017 | $1,382 | $175,510 | $50,000 | $125,510 |
| 2016 | $1,337 | $160,300 | $40,000 | $120,300 |
| 2015 | $1,323 | $156,100 | $37,000 | $119,100 |
| 2013 | $1,235 | $134,270 | $32,000 | $102,270 |
Source: Public Records
Map
Nearby Homes
- 3576 N Blaze Loop
- 3566 N Blaze Loop
- 3556 N Blaze Loop
- 3788 N Shelburne Loop
- 3542 N Blaze Loop
- 3510 N Blaze Loop
- 3752 N Shelburne Loop
- 333 E Penrose Ave
- 3606 N Blaze Loop
- 3624 N Blaze Loop
- 3596 Blaze Loop
- 3679 N Blaze Loop
- 3648 N Blaze Loop
- 3636 N Blaze Loop
- 585 N Divot Ave
- 3351 N Blaze Loop
- 4224 N Brookie Dr
- 109 W Tennessee Ave
- 880 E Allenby Ct
- 276 W Blanton Ave
- 385 E Tiger Ave
- 390 E Tiger Ave
- 375 E Tiger Ave
- 3500 N Ping Rd
- 3535 N Ping Rd
- 3525 N Ping Rd
- 400 E Tiger Ave
- 3515 N Ping Rd
- 410 E Tiger Ave
- 365 E Tiger Ave
- 3480 N Ping Rd
- 3505 N Ping Rd
- 420 E Tiger Ave
- 421 E Tiger Ave
- 3939 N Shelburne Loop
- 3460 N Ping Rd
- 3495 N Ping Rd
- 355 E Tiger Ave
- 3925 N Shelburne Loop
- 3907 N Shelburne Loop
Your Personal Tour Guide
Ask me questions while you tour the home.