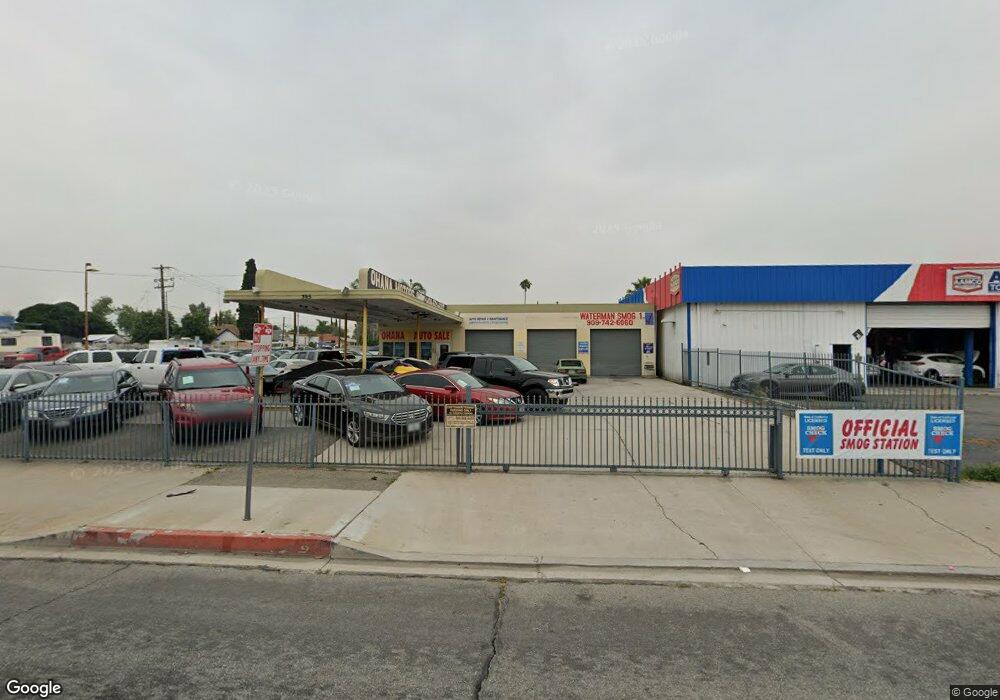
395 Waterman Ave Unit 1200 sf. San Bernardino, CA 92410
International NeighborhoodEstimated Value: $334,952
2
Beds
1
Bath
1,539
Sq Ft
$218/Sq Ft
Est. Value
About This Home
This home is located at 395 Waterman Ave Unit 1200 sf., San Bernardino, CA 92410 and is currently estimated at $334,952, approximately $217 per square foot. 395 Waterman Ave Unit 1200 sf. is a home located in San Bernardino County with nearby schools including Monterey Elementary School, Curtis Middle School, and Indian Springs High.
Ownership History
Date
Name
Owned For
Owner Type
Purchase Details
Closed on
Mar 28, 2016
Sold by
Demes Issa T and Demes Deborah Marissa
Bought by
Demes Issa Tawfik and Demes Deborah Marissa
Current Estimated Value
Purchase Details
Closed on
Jan 14, 2014
Sold by
Shihada Haitham and Muasher Shihada Lulu
Bought by
Domes Issa T and Demes Deborah Marissa
Purchase Details
Closed on
Dec 2, 2005
Sold by
Fox Glenn G and Fox Nancy R
Bought by
Shihada Haitham S and Muasher Shihada Lulu
Home Financials for this Owner
Home Financials are based on the most recent Mortgage that was taken out on this home.
Original Mortgage
$452,000
Interest Rate
6.21%
Mortgage Type
Commercial
Purchase Details
Closed on
Oct 22, 1997
Sold by
Mcdermith James W
Bought by
Mcdermith James W and Nancy Finley Trust
Purchase Details
Closed on
Dec 29, 1994
Sold by
Heckman Opal F
Bought by
Mcdermith James W
Create a Home Valuation Report for This Property
The Home Valuation Report is an in-depth analysis detailing your home's value as well as a comparison with similar homes in the area
Home Values in the Area
Average Home Value in this Area
Purchase History
| Date | Buyer | Sale Price | Title Company |
|---|---|---|---|
| Demes Issa Tawfik | -- | None Available | |
| Domes Issa T | $150,000 | North American Title Company | |
| Shihada Haitham S | $470,000 | Commerce Title Company | |
| Mcdermith James W | -- | -- | |
| Mcdermith James W | -- | -- | |
| Mcdermith James W | -- | -- |
Source: Public Records
Mortgage History
| Date | Status | Borrower | Loan Amount |
|---|---|---|---|
| Previous Owner | Shihada Haitham S | $452,000 |
Source: Public Records
Tax History Compared to Growth
Tax History
| Year | Tax Paid | Tax Assessment Tax Assessment Total Assessment is a certain percentage of the fair market value that is determined by local assessors to be the total taxable value of land and additions on the property. | Land | Improvement |
|---|---|---|---|---|
| 2025 | $2,826 | $216,980 | $114,006 | $102,974 |
| 2024 | $2,826 | $212,726 | $111,771 | $100,955 |
| 2023 | $2,756 | $208,554 | $109,579 | $98,975 |
| 2022 | $2,759 | $204,464 | $107,430 | $97,034 |
| 2021 | $2,763 | $200,455 | $105,324 | $95,131 |
| 2020 | $2,769 | $198,400 | $104,244 | $94,156 |
| 2019 | $2,688 | $194,510 | $102,200 | $92,310 |
| 2018 | $2,539 | $190,696 | $100,196 | $90,500 |
| 2017 | $2,462 | $186,956 | $98,231 | $88,725 |
| 2016 | $2,389 | $183,290 | $96,305 | $86,985 |
| 2015 | $3,269 | $243,775 | $101,998 | $141,777 |
| 2014 | $3,179 | $239,000 | $100,000 | $139,000 |
Source: Public Records
Map
Nearby Homes
- 273 E Kingman St
- 24261 4th St
- 261 E Kingman St
- 268 E Kingman St
- 255 E Kingman St
- 258 Bryant St
- 252 N Allen St
- 474 Sepulveda Ave
- 24549 Court St
- 149 W 6th St Unit 42
- 149 W 6th St Unit 8
- 0 N Mountain View Ave
- 0 N Arrowhead Ave
- 0 Kramer Juntion Unit /46 250031305
- 24724 Court St
- 325 W 6th St
- 119 E 9th St
- 24744 5th St
- 868 E Rialto Ave
- 1600 Walnut St Spc 21