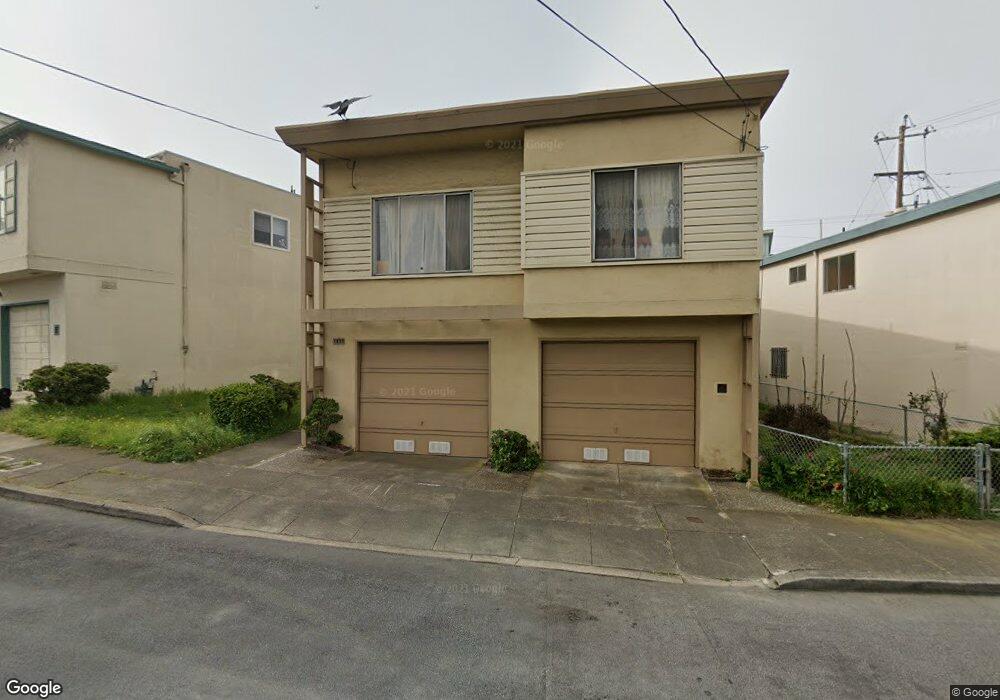
395 Winding Way San Francisco, CA 94112
Crocker Amazon NeighborhoodEstimated Value: $1,134,780 - $1,271,000
3
Beds
1
Bath
1,168
Sq Ft
$1,050/Sq Ft
Est. Value
About This Home
This home is located at 395 Winding Way, San Francisco, CA 94112 and is currently estimated at $1,225,945, approximately $1,049 per square foot. 395 Winding Way is a home located in San Francisco County with nearby schools including Guadalupe Elementary School, Visitacion Valley Middle School, and Leadership High School.
Ownership History
Date
Name
Owned For
Owner Type
Purchase Details
Closed on
Nov 5, 2020
Sold by
Yu William Wen Dong
Bought by
Yu William Wen Dong and Wong Lisa L
Current Estimated Value
Home Financials for this Owner
Home Financials are based on the most recent Mortgage that was taken out on this home.
Original Mortgage
$312,000
Outstanding Balance
$277,183
Interest Rate
2.71%
Mortgage Type
New Conventional
Estimated Equity
$948,762
Purchase Details
Closed on
Oct 19, 2014
Sold by
Yu William Wen Dong and Tan Yin Hao
Bought by
Yu William Wen Dong
Purchase Details
Closed on
Dec 29, 2013
Sold by
Yu William Wen Dong and Yu Zhan Yong
Bought by
Yu William Wen Dong and Tan Yin Hao
Purchase Details
Closed on
Apr 18, 2012
Sold by
Cavanaugh Marianne
Bought by
Yu Wen Dong William and Yu Zhan Yong
Home Financials for this Owner
Home Financials are based on the most recent Mortgage that was taken out on this home.
Original Mortgage
$407,200
Interest Rate
3.9%
Mortgage Type
New Conventional
Create a Home Valuation Report for This Property
The Home Valuation Report is an in-depth analysis detailing your home's value as well as a comparison with similar homes in the area
Home Values in the Area
Average Home Value in this Area
Purchase History
| Date | Buyer | Sale Price | Title Company |
|---|---|---|---|
| Yu William Wen Dong | -- | Chicago Title Company | |
| Yu William Wen Dong | -- | None Available | |
| Yu William Wen Dong | -- | None Available | |
| Yu Wen Dong William | $520,500 | First American Title Company |
Source: Public Records
Mortgage History
| Date | Status | Borrower | Loan Amount |
|---|---|---|---|
| Open | Yu William Wen Dong | $312,000 | |
| Closed | Yu Wen Dong William | $407,200 |
Source: Public Records
Tax History Compared to Growth
Tax History
| Year | Tax Paid | Tax Assessment Tax Assessment Total Assessment is a certain percentage of the fair market value that is determined by local assessors to be the total taxable value of land and additions on the property. | Land | Improvement |
|---|---|---|---|---|
| 2025 | $9,144 | $653,512 | $457,461 | $196,051 |
| 2024 | $9,144 | $720,210 | $448,492 | $271,718 |
| 2023 | $8,710 | $681,581 | $439,699 | $241,882 |
| 2022 | $8,539 | $668,709 | $431,078 | $237,631 |
| 2021 | $8,093 | $631,064 | $422,617 | $208,447 |
| 2020 | $8,142 | $624,597 | $418,285 | $206,312 |
| 2019 | $7,864 | $612,356 | $410,086 | $202,270 |
| 2018 | $7,598 | $600,290 | $402,005 | $198,285 |
| 2017 | $7,209 | $588,524 | $394,124 | $194,400 |
| 2016 | $6,779 | $551,992 | $386,398 | $165,594 |
| 2015 | $6,692 | $543,644 | $380,554 | $163,090 |
| 2014 | $6,516 | $533,055 | $373,141 | $159,914 |
Source: Public Records
Map
Nearby Homes
- 277 Polaris Way
- 1123 Munich St
- 188 Pope St
- 2 Byron Ct
- 20 Frankfort St
- 1125 Naples St
- 1003 San Antonio Cir Unit 303
- 35 Guttenberg St
- 1118 Geneva Ave
- 21 Hollywood Ct
- 398 Ardendale Dr
- 1287 Geneva Ave
- 52 Rolph St
- 5306-5308 Mission St
- 5284 Mission St
- 5254 Mission St
- 86 Ellington Ave
- 108 Naglee Ave
- 57 Niagara Ave
- 757 Rolph St
- 399 Winding Way
- 391 Winding Way
- 387 Winding Way
- 392 Baltimore Way
- 388 Baltimore Way
- 385 Winding Way
- 384 Baltimore Way
- 380 Baltimore Way
- 381 Winding Way
- 400 Pope St
- 404 Pope St
- 376 Baltimore Way
- 408 Pope St
- 1160 Prague St
- 379 Winding Way
- 1170 Prague St
- 412 Pope St
- 398 Winding Way
- 1150 Prague St
- 19 Hanover St