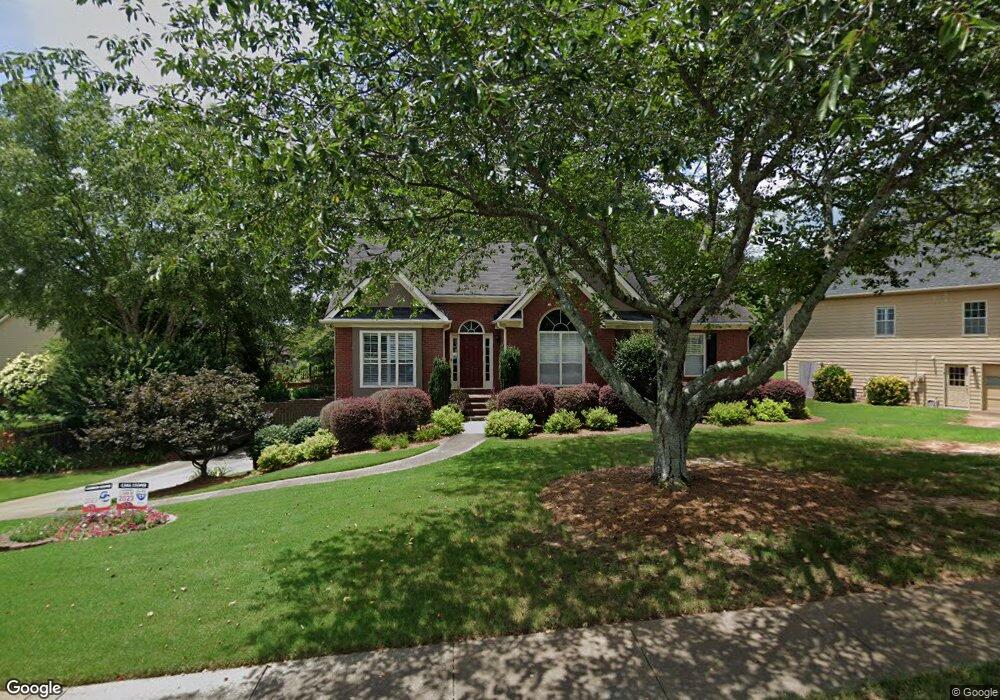
3950 Cherry Ridge Walk Unit 1 Suwanee, GA 30024
Estimated Value: $562,563 - $605,000
4
Beds
3
Baths
1,624
Sq Ft
$357/Sq Ft
Est. Value
About This Home
This home is located at 3950 Cherry Ridge Walk Unit 1, Suwanee, GA 30024 and is currently estimated at $579,391, approximately $356 per square foot. 3950 Cherry Ridge Walk Unit 1 is a home located in Gwinnett County with nearby schools including Roberts Elementary School, North Gwinnett Middle School, and North Gwinnett High School.
Ownership History
Date
Name
Owned For
Owner Type
Purchase Details
Closed on
Sep 3, 2020
Sold by
Cooper Curtis
Bought by
Curtis Cooper & Daphne Cooper Liv Trust
Current Estimated Value
Purchase Details
Closed on
Jul 9, 2004
Sold by
Raper Jimmy
Bought by
Cooper Custis N and Cooper Daphne
Home Financials for this Owner
Home Financials are based on the most recent Mortgage that was taken out on this home.
Original Mortgage
$35,950
Interest Rate
6.22%
Mortgage Type
Unknown
Purchase Details
Closed on
Apr 30, 2003
Sold by
Rabitsch William K and Rabitsch Suzanne H
Bought by
Raper Jimmy
Home Financials for this Owner
Home Financials are based on the most recent Mortgage that was taken out on this home.
Original Mortgage
$236,900
Interest Rate
5.76%
Mortgage Type
New Conventional
Create a Home Valuation Report for This Property
The Home Valuation Report is an in-depth analysis detailing your home's value as well as a comparison with similar homes in the area
Home Values in the Area
Average Home Value in this Area
Purchase History
| Date | Buyer | Sale Price | Title Company |
|---|---|---|---|
| Curtis Cooper & Daphne Cooper Liv Trust | -- | -- | |
| Cooper Custis N | $239,900 | -- | |
| Raper Jimmy | $230,000 | -- |
Source: Public Records
Mortgage History
| Date | Status | Borrower | Loan Amount |
|---|---|---|---|
| Previous Owner | Cooper Custis N | $35,950 | |
| Previous Owner | Cooper Custis N | $191,900 | |
| Previous Owner | Raper Jimmy | $236,900 |
Source: Public Records
Tax History Compared to Growth
Tax History
| Year | Tax Paid | Tax Assessment Tax Assessment Total Assessment is a certain percentage of the fair market value that is determined by local assessors to be the total taxable value of land and additions on the property. | Land | Improvement |
|---|---|---|---|---|
| 2025 | $4,728 | $199,200 | $38,000 | $161,200 |
| 2024 | $5,225 | $215,920 | $40,000 | $175,920 |
| 2023 | $5,225 | $199,600 | $40,000 | $159,600 |
| 2022 | $5,285 | $172,360 | $37,600 | $134,760 |
| 2021 | $3,883 | $117,880 | $24,920 | $92,960 |
| 2020 | $3,913 | $117,880 | $24,920 | $92,960 |
| 2019 | $3,324 | $117,880 | $24,920 | $92,960 |
| 2018 | $3,342 | $117,880 | $24,920 | $92,960 |
| 2016 | $2,941 | $99,400 | $27,600 | $71,800 |
| 2015 | $2,877 | $94,840 | $23,600 | $71,240 |
| 2014 | -- | $90,280 | $21,200 | $69,080 |
Source: Public Records
Map
Nearby Homes
- 105 Treemont Trace
- 4080 Cherry Ridge Walk Unit 1
- 225 Ruby Forest Pkwy
- 235 Ruby Forest Pkwy
- 4094 Dollar Cir Unit 2
- 270 Dogwood View Ct
- 297 Dogwood View Ln
- 4244 Austin Hills Dr
- 366 Regal Pines Ct
- 212 Suwanee Ave
- 4394 Austin Hills Dr Unit 1
- 374 Creek Manor Way
- 4045 Hillcrest View Ct
- 384 Creek Manor Way
- 3971 Savannah Square St
- 0 Mohawk Trail Unit 7688155
- 0 Mohawk Trail Unit 10652266
- 3779 Lawrenceville Suwanee
- 4186 Terrace Oaks Ct
- 350 Suwanee Ave
- 3890 Cherry Ridge Walk
- 75 Cherrystone Walk Unit 75
- 75 Cherrystone Walk
- 75 Cherrystone Walk Unit 1
- 65 Cherrystone Walk
- 3880 Cherry Ridge Walk Unit 1
- 3945 Cherry Ridge Walk
- 3955 Cherry Ridge Walk
- 55 Cherrystone Walk
- 3870 Cherry Ridge Walk Unit 1
- 3935 Cherry Ridge Walk
- 35 Cherrystone Walk
- 3975 Cherry Ridge Walk
- 0 Cherrystone Walk Unit 7064130
- 3860 Cherry Ridge Walk
- 70 Cherrystone Walk
- 3895 Cherry Ridge Walk
- 60 Cherrystone Walk Unit 1
- 3885 Cherry Ridge Walk Unit 1
- 3905 Cherry Ridge Walk Unit 1