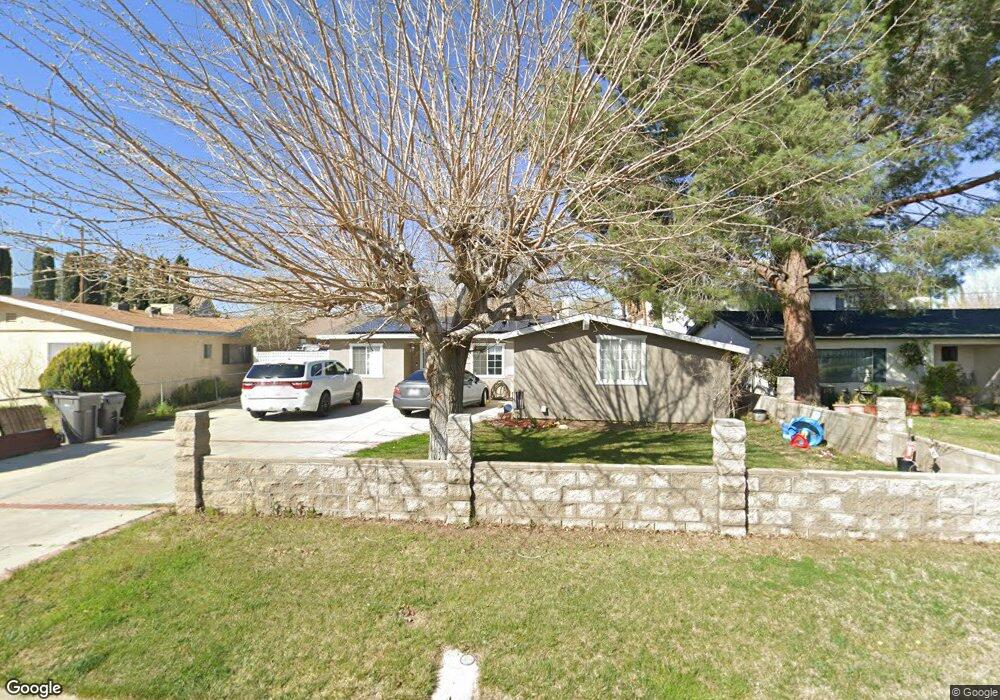
39507 12th St W Palmdale, CA 93551
West Palmdale NeighborhoodEstimated Value: $366,000 - $456,000
3
Beds
2
Baths
1,080
Sq Ft
$381/Sq Ft
Est. Value
About This Home
This home is located at 39507 12th St W, Palmdale, CA 93551 and is currently estimated at $410,995, approximately $380 per square foot. 39507 12th St W is a home located in Los Angeles County with nearby schools including Summerwind Elementary School, David G. Millen Magnet Academy, and Highland High School.
Ownership History
Date
Name
Owned For
Owner Type
Purchase Details
Closed on
Oct 10, 2005
Sold by
Mendoza Felipe
Bought by
Mendoza Felipe and Mendoza Maria
Current Estimated Value
Home Financials for this Owner
Home Financials are based on the most recent Mortgage that was taken out on this home.
Original Mortgage
$225,000
Outstanding Balance
$119,011
Interest Rate
5.67%
Mortgage Type
New Conventional
Estimated Equity
$291,984
Purchase Details
Closed on
May 3, 2004
Sold by
Mendoza Maria
Bought by
Mendoza Felipe
Home Financials for this Owner
Home Financials are based on the most recent Mortgage that was taken out on this home.
Original Mortgage
$150,500
Interest Rate
5.99%
Mortgage Type
New Conventional
Purchase Details
Closed on
Jul 13, 2001
Sold by
Hunt Patricia M
Bought by
Mendoza Felipe and Mendoza Maria
Home Financials for this Owner
Home Financials are based on the most recent Mortgage that was taken out on this home.
Original Mortgage
$94,158
Interest Rate
7.1%
Mortgage Type
FHA
Create a Home Valuation Report for This Property
The Home Valuation Report is an in-depth analysis detailing your home's value as well as a comparison with similar homes in the area
Home Values in the Area
Average Home Value in this Area
Purchase History
| Date | Buyer | Sale Price | Title Company |
|---|---|---|---|
| Mendoza Felipe | -- | Southland Title | |
| Mendoza Felipe | -- | First American Title Co | |
| Mendoza Felipe | $95,000 | Investors Title Company |
Source: Public Records
Mortgage History
| Date | Status | Borrower | Loan Amount |
|---|---|---|---|
| Open | Mendoza Felipe | $225,000 | |
| Closed | Mendoza Felipe | $150,500 | |
| Closed | Mendoza Felipe | $94,158 |
Source: Public Records
Tax History Compared to Growth
Tax History
| Year | Tax Paid | Tax Assessment Tax Assessment Total Assessment is a certain percentage of the fair market value that is determined by local assessors to be the total taxable value of land and additions on the property. | Land | Improvement |
|---|---|---|---|---|
| 2025 | $3,349 | $350,706 | $87,676 | $263,030 |
| 2024 | $3,198 | $343,830 | $85,957 | $257,873 |
| 2023 | $5,197 | $337,089 | $84,272 | $252,817 |
| 2022 | $5,335 | $330,480 | $82,620 | $247,860 |
| 2021 | $2,638 | $136,530 | $25,921 | $110,609 |
| 2020 | $2,614 | $135,131 | $25,656 | $109,475 |
| 2019 | $2,581 | $132,482 | $25,153 | $107,329 |
| 2018 | $2,544 | $129,885 | $24,660 | $105,225 |
| 2016 | $2,377 | $124,843 | $23,703 | $101,140 |
| 2015 | $2,350 | $122,968 | $23,347 | $99,621 |
| 2014 | $2,316 | $120,560 | $22,890 | $97,670 |
Source: Public Records
Map
Nearby Homes
- 1225 Stanfill Rd
- 1234 Wellington Dr
- 39366 11th St W
- 39221 Foxholm Dr
- 1555 Berkshire Dr
- 0000 27 Ave
- 39566 Dunbar St
- 1515 W Avenue o12
- 1792 W Avenue p4
- 39834 16th St W
- 38994 Foxholm Dr
- 38953 Foxholm Dr
- 39524 Hawthorne St
- 38869 Juniper Tree Rd
- 38910 Sage Tree St
- 0 10th St W Unit SR24203861
- 0 10th St W Unit 24002615
- 38833 Sage Tree St
- 38895 Silica Dr
- 1796 Vincent Dr
- 39513 12th St W
- 39503 12th St W
- 39406 Gainsborough Dr
- 39519 12th St W
- 39493 12th St W
- 39346 Gainsborough Dr
- 39412 Gainsborough Dr
- 39340 Gainsborough Dr
- 39420 Gainsborough Dr
- 39502 12th St W
- 39525 12th St W
- 39475 12th St W
- 39494 12th St W
- 39350 12th St W
- 39518 12th St W
- 39426 Gainsborough Dr
- 39531 12th St W
- 39324 Gainsborough Dr
- 39524 12th St W
- 1231 Berkshire Dr