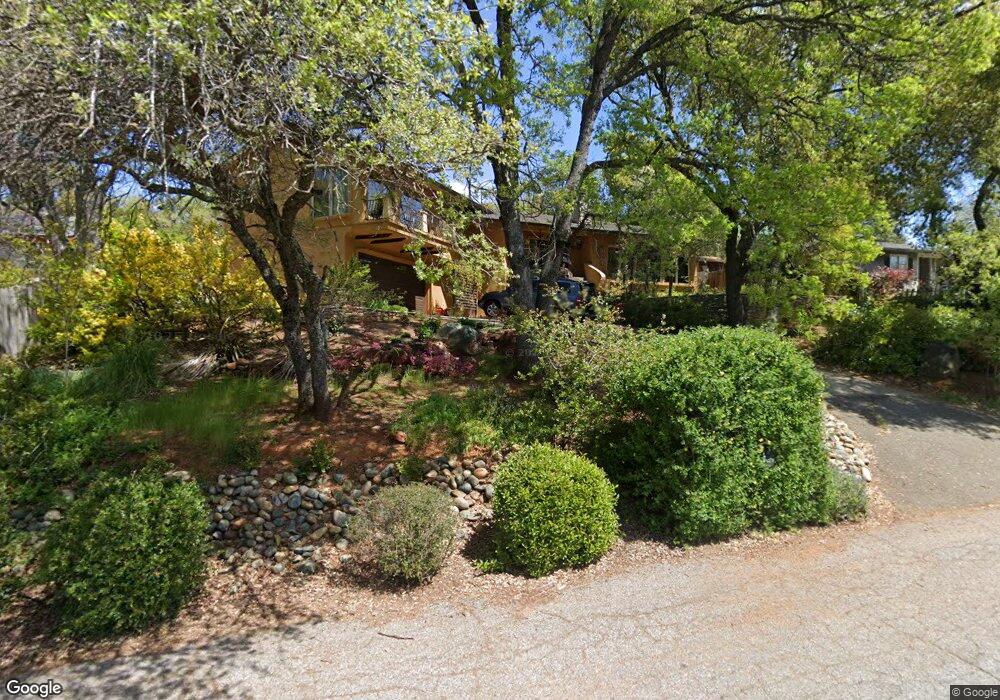
3951 Rustic Rd Cameron Park, CA 95682
Estimated Value: $527,806 - $613,000
3
Beds
2
Baths
1,904
Sq Ft
$299/Sq Ft
Est. Value
About This Home
This home is located at 3951 Rustic Rd, Cameron Park, CA 95682 and is currently estimated at $568,952, approximately $298 per square foot. 3951 Rustic Rd is a home located in El Dorado County with nearby schools including Camerado Springs Middle School, Ponderosa High School, and California Montessori Project-Shingle Springs Campus.
Ownership History
Date
Name
Owned For
Owner Type
Purchase Details
Closed on
Sep 8, 2017
Sold by
Rounds Adrian and Rounds Lynda L
Bought by
Rounds Adrian and Rounds Lynda L
Current Estimated Value
Purchase Details
Closed on
Jan 8, 2010
Sold by
Schwartz Ellery Stewart and Schwartz Nancy
Bought by
Rounds Adrian and Rounds Lynda L
Purchase Details
Closed on
Dec 31, 2009
Sold by
Schwartz Ellery Stewart and Schwartz Nancy
Bought by
Rounds Adrian and Rounds Lynda L
Purchase Details
Closed on
Jan 19, 1995
Sold by
Schwartz Ellery Stewart and Schwartz Nancy
Bought by
Schwartz Ellery Stewart and Schwartz Nancy
Purchase Details
Closed on
Oct 27, 1993
Sold by
Schwartz Ellery and Schwartz Nancy
Bought by
Schwartz Ellery and Schwartz Nancy
Home Financials for this Owner
Home Financials are based on the most recent Mortgage that was taken out on this home.
Original Mortgage
$131,250
Interest Rate
6.97%
Create a Home Valuation Report for This Property
The Home Valuation Report is an in-depth analysis detailing your home's value as well as a comparison with similar homes in the area
Home Values in the Area
Average Home Value in this Area
Purchase History
| Date | Buyer | Sale Price | Title Company |
|---|---|---|---|
| Rounds Adrian | -- | None Available | |
| Rounds Adrian | -- | None Available | |
| Rounds Adrian | -- | None Available | |
| Schwartz Ellery Stewart | -- | None Available | |
| Schwartz Ellery Stewart | -- | -- | |
| Schwartz Ellery | -- | Inter County Title Co |
Source: Public Records
Mortgage History
| Date | Status | Borrower | Loan Amount |
|---|---|---|---|
| Previous Owner | Schwartz Ellery | $131,250 |
Source: Public Records
Tax History
| Year | Tax Paid | Tax Assessment Tax Assessment Total Assessment is a certain percentage of the fair market value that is determined by local assessors to be the total taxable value of land and additions on the property. | Land | Improvement |
|---|---|---|---|---|
| 2025 | $1,855 | $176,629 | $20,747 | $155,882 |
| 2024 | $1,855 | $173,167 | $20,341 | $152,826 |
| 2023 | $1,820 | $169,773 | $19,943 | $149,830 |
| 2022 | $1,793 | $166,445 | $19,552 | $146,893 |
| 2021 | $1,769 | $163,182 | $19,169 | $144,013 |
| 2020 | $1,746 | $161,510 | $18,973 | $142,537 |
| 2019 | $1,716 | $158,344 | $18,601 | $139,743 |
| 2018 | $1,671 | $155,240 | $18,237 | $137,003 |
| 2017 | $1,636 | $152,197 | $17,880 | $134,317 |
| 2016 | $1,615 | $149,214 | $17,530 | $131,684 |
| 2015 | $1,567 | $146,975 | $17,268 | $129,707 |
| 2014 | $1,567 | $144,098 | $16,931 | $127,167 |
Source: Public Records
Map
Nearby Homes
- 3937 Rustic Rd
- 3980 Rustic Rd
- 3276 Heights Dr Unit A
- 3264 Heights Dr
- 3293 Topaz Ln
- 3048 Merrywood Cir
- 3088 Emerald Ct Unit 2
- 2780 Holly Hills Ln
- 3788 Hillsborough Rd
- 3953 Arthur Ct Unit 14
- 3002 Tri Ln
- 3619 Montclair Rd
- 3817 Los Santos Dr
- 3569 Cambridge Rd
- 3287 Country Club Dr
- 2801 Osborne Rd
- 3708 Millbrae Rd
- 3516 Montclair Rd
- 3691 Hampton Ln
- 3213 Dogleg Ct
- 3943 Rustic Rd
- 3959 Rustic Rd
- 3924 Hillsborough Rd
- 3969 Rustic Rd
- 3952 Rustic Rd
- 3944 Rustic Rd
- 3938 Hillsborough Rd
- 3918 Hillsborough Rd
- 3936 Rustic Rd
- 3929 Rustic Rd
- 3968 Rustic Rd
- 3975 Rustic Rd
- 3939 Hillsborough Rd
- 3927 Hillsborough Rd
- 3910 Hillsborough Rd
- 3928 Rustic Rd
- 3944 Hillsborough Rd
- 2931 Country Club Dr
- 2953 Country Club Dr
- 3050 Cedarhurst Ct
Your Personal Tour Guide
Ask me questions while you tour the home.