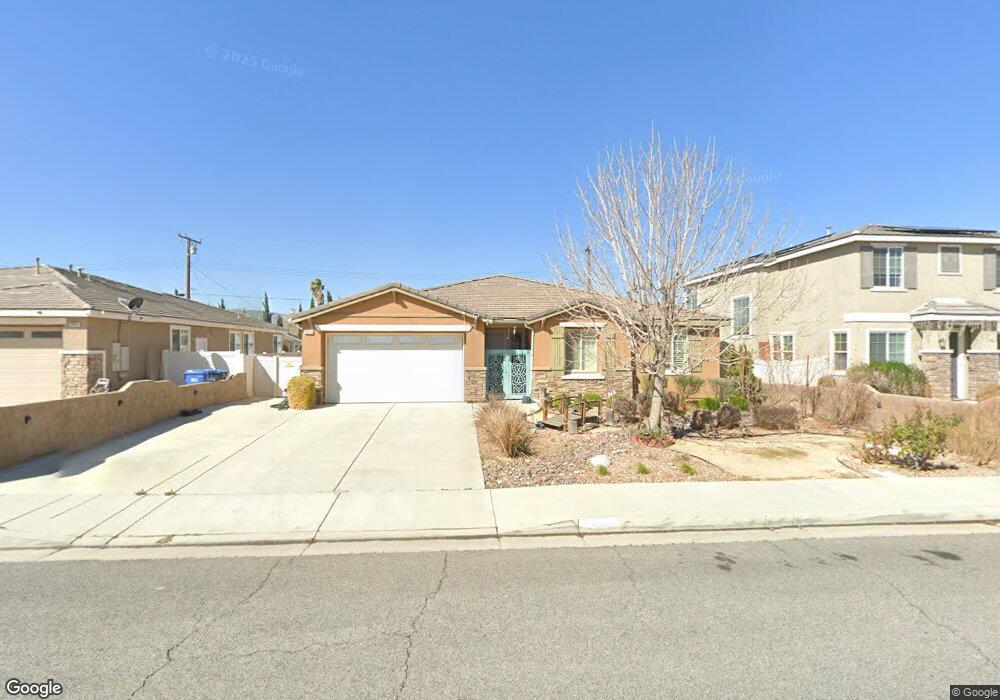
39511 11th St W Palmdale, CA 93551
West Palmdale NeighborhoodEstimated Value: $533,819 - $592,000
3
Beds
2
Baths
1,905
Sq Ft
$291/Sq Ft
Est. Value
About This Home
This home is located at 39511 11th St W, Palmdale, CA 93551 and is currently estimated at $555,205, approximately $291 per square foot. 39511 11th St W is a home located in Los Angeles County with nearby schools including Summerwind Elementary School, David G. Millen Magnet Academy, and Highland High School.
Ownership History
Date
Name
Owned For
Owner Type
Purchase Details
Closed on
Oct 3, 2016
Sold by
Turpin Virainia Anaeles
Bought by
Turpin Virginia Gigi Angeles and Virginia Gigi Angeles Turpin Living Trus
Current Estimated Value
Purchase Details
Closed on
Sep 19, 2016
Sold by
Turpin Virginia Angeles
Bought by
Turpin Virginia Gigi Angeles and Virginia Gigi Angeles Turpin Living Trus
Purchase Details
Closed on
Aug 31, 2011
Sold by
Turpin Virginia A
Bought by
Turpin Virginia Angeles and The Turpin Trust
Purchase Details
Closed on
Jul 13, 2010
Sold by
Beazer Homes Holdings Corp
Bought by
Turpin Virginia
Home Financials for this Owner
Home Financials are based on the most recent Mortgage that was taken out on this home.
Original Mortgage
$181,592
Outstanding Balance
$120,610
Interest Rate
4.71%
Mortgage Type
New Conventional
Estimated Equity
$434,595
Purchase Details
Closed on
Aug 29, 2005
Sold by
Woods Canyon Associates Lp
Bought by
Beazer Homes Holdings Corp
Create a Home Valuation Report for This Property
The Home Valuation Report is an in-depth analysis detailing your home's value as well as a comparison with similar homes in the area
Home Values in the Area
Average Home Value in this Area
Purchase History
| Date | Buyer | Sale Price | Title Company |
|---|---|---|---|
| Turpin Virginia Gigi Angeles | -- | None Available | |
| Turpin Virginia Gigi Angeles | -- | None Available | |
| Turpin Virginia Angeles | -- | None Available | |
| Turpin Virginia | $235,500 | Fidelity National Title Co | |
| Beazer Homes Holdings Corp | -- | Fidelity National Title Co |
Source: Public Records
Mortgage History
| Date | Status | Borrower | Loan Amount |
|---|---|---|---|
| Open | Turpin Virginia | $181,592 |
Source: Public Records
Tax History Compared to Growth
Tax History
| Year | Tax Paid | Tax Assessment Tax Assessment Total Assessment is a certain percentage of the fair market value that is determined by local assessors to be the total taxable value of land and additions on the property. | Land | Improvement |
|---|---|---|---|---|
| 2025 | $5,678 | $301,318 | $75,325 | $225,993 |
| 2024 | $5,678 | $295,411 | $73,849 | $221,562 |
| 2023 | $5,578 | $289,619 | $72,401 | $217,218 |
| 2022 | $5,394 | $283,941 | $70,982 | $212,959 |
| 2021 | $5,269 | $278,375 | $69,591 | $208,784 |
| 2019 | $5,127 | $270,121 | $67,528 | $202,593 |
| 2018 | $5,045 | $264,825 | $66,204 | $198,621 |
| 2016 | $4,698 | $254,543 | $63,634 | $190,909 |
| 2015 | $4,647 | $250,721 | $62,679 | $188,042 |
| 2014 | $4,567 | $245,811 | $61,452 | $184,359 |
Source: Public Records
Map
Nearby Homes
- 39366 11th St W
- 1225 Stanfill Rd
- 1234 Wellington Dr
- 39413 Southcliff Way
- 39221 Foxholm Dr
- 1555 Berkshire Dr
- 1515 W Avenue o12
- 0000 27 Ave
- 39566 Dunbar St
- 39834 16th St W
- 1792 W Avenue p4
- 39752 Makin Ave
- 38994 Foxholm Dr
- 0 10th St W Unit SR24203861
- 0 10th St W Unit 24002615
- 38910 Sage Tree St
- 38869 Juniper Tree Rd
- 38953 Foxholm Dr
- 39524 Hawthorne St
- 38833 Sage Tree St
- 39519 11th St W
- 39503 11th St W
- 39542 Armfield Ave
- 39527 11th St W
- 39459 11th St W
- 39536 Armfield Ave
- 39548 Armfield Ave
- 39512 11th St W
- 39554 Armfield Ave
- 39530 Armfield Ave
- 39520 11th St W
- 39504 11th St W
- 39533 11th St W
- 39453 11th St W
- 39460 11th St W
- 39528 11th St W
- 39560 Armfield Ave
- 39524 Armfield Ave
- 39534 11th St W
- 39452 11th St W