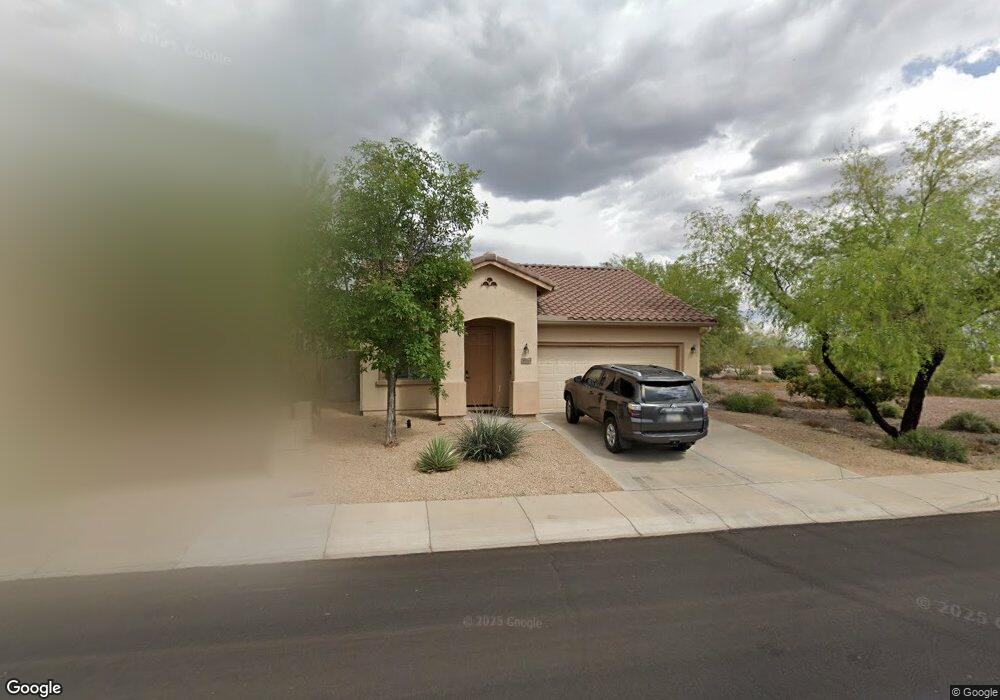
39513 N Hillerman Way Unit 53 Phoenix, AZ 85086
Estimated Value: $480,000 - $553,000
4
Beds
2
Baths
1,800
Sq Ft
$285/Sq Ft
Est. Value
About This Home
This home is located at 39513 N Hillerman Way Unit 53, Phoenix, AZ 85086 and is currently estimated at $513,176, approximately $285 per square foot. 39513 N Hillerman Way Unit 53 is a home located in Maricopa County with nearby schools including Diamond Canyon Elementary School and Boulder Creek High School.
Ownership History
Date
Name
Owned For
Owner Type
Purchase Details
Closed on
Dec 22, 2004
Sold by
Trejos Luis E
Bought by
Brooks Vonda L
Current Estimated Value
Home Financials for this Owner
Home Financials are based on the most recent Mortgage that was taken out on this home.
Original Mortgage
$202,000
Outstanding Balance
$102,975
Interest Rate
6%
Mortgage Type
Purchase Money Mortgage
Estimated Equity
$410,201
Purchase Details
Closed on
Sep 17, 2004
Sold by
Trejos Norma L
Bought by
Trejos Luis E
Home Financials for this Owner
Home Financials are based on the most recent Mortgage that was taken out on this home.
Original Mortgage
$216,730
Interest Rate
8.25%
Mortgage Type
Purchase Money Mortgage
Create a Home Valuation Report for This Property
The Home Valuation Report is an in-depth analysis detailing your home's value as well as a comparison with similar homes in the area
Home Values in the Area
Average Home Value in this Area
Purchase History
| Date | Buyer | Sale Price | Title Company |
|---|---|---|---|
| Brooks Vonda L | $252,500 | First American Title Ins Co | |
| Trejos Luis E | -- | Sun Title Agency Co | |
| Trejos Luis E | $228,136 | Sun Title Agency Co | |
| Del Webbs Coventry Homes Inc | -- | Sun Title Agency Co |
Source: Public Records
Mortgage History
| Date | Status | Borrower | Loan Amount |
|---|---|---|---|
| Open | Brooks Vonda L | $202,000 | |
| Previous Owner | Del Webbs Coventry Homes Inc | $216,730 | |
| Closed | Brooks Vonda L | $50,500 |
Source: Public Records
Tax History Compared to Growth
Tax History
| Year | Tax Paid | Tax Assessment Tax Assessment Total Assessment is a certain percentage of the fair market value that is determined by local assessors to be the total taxable value of land and additions on the property. | Land | Improvement |
|---|---|---|---|---|
| 2025 | $2,840 | $26,452 | -- | -- |
| 2024 | $2,671 | $25,193 | -- | -- |
| 2023 | $2,671 | $36,410 | $7,280 | $29,130 |
| 2022 | $2,553 | $26,830 | $5,360 | $21,470 |
| 2021 | $2,629 | $25,430 | $5,080 | $20,350 |
| 2020 | $2,572 | $23,100 | $4,620 | $18,480 |
| 2019 | $2,523 | $21,800 | $4,360 | $17,440 |
| 2018 | $2,443 | $21,860 | $4,370 | $17,490 |
| 2017 | $2,395 | $20,530 | $4,100 | $16,430 |
| 2016 | $2,150 | $20,230 | $4,040 | $16,190 |
| 2015 | $1,993 | $19,000 | $3,800 | $15,200 |
Source: Public Records
Map
Nearby Homes
- 39605 N Bent Creek Ct Unit 53
- 1910 W St Exupery Dr
- 39809 N Messner Way
- 39531 N White Tail Ln
- 39818 N Bell Meadow Trail
- 39617 N Prairie Ln Unit 55
- 1806 W Twain Dr
- 0 N 9th Ave Unit 6524872
- 40130 N Thunder Hills Ct Unit 32
- 1742 W Owens Way Unit 32
- 1816 W Owens Way
- 40201 N Hickok Trail
- 1676 W Owens Way
- 1635 W Owens Way Unit 32
- 2026 W Hidden Treasure Way Unit 29
- 38913 N 21st Ave
- 2237 W Twain Dr Unit 39
- 1626 W Morse Dr Unit 32
- 40205 N Lytham Way
- 1783 W Dion Dr
- 39517 N Hillerman Way
- 39521 N Hillerman Way
- 39525 N Hillerman Way
- 39518 N Bent Creek Ct
- 39522 N Bent Creek Ct Unit 53
- 39526 N Bent Creek Ct
- 39529 N Hillerman Way
- 39530 N Bent Creek Ct Unit 53
- 39512 N Hillerman Way
- 39516 N Hillerman Way
- 35939 N Prairie Ln
- 39520 N Hillerman Way Unit 53
- 39533 N Hillerman Way Unit 53
- 39534 N Bent Creek Ct
- 39524 N Hillerman Way
- 39528 N Hillerman Way
- 39532 N Hillerman Way
- 39510 N Bent Creek Ct
- 39521 N Noble Hawk Ct
- 39517 N Noble Hawk Ct