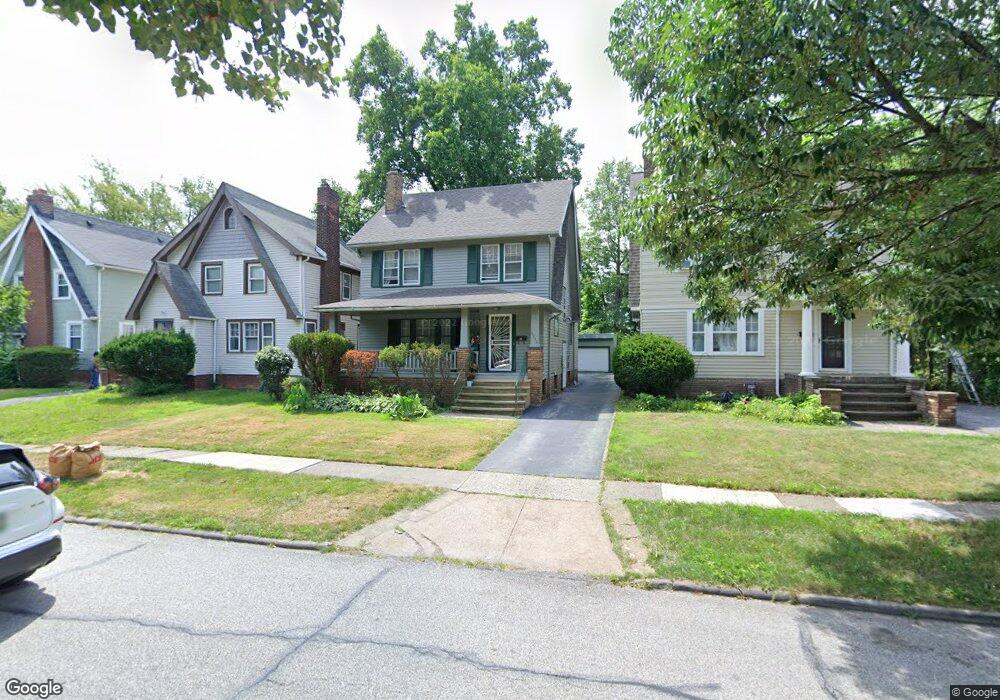
3952 Ardmore Rd Cleveland, OH 44121
Monticello-Noble NeighborhoodEstimated Value: $120,000 - $176,000
3
Beds
1
Bath
1,420
Sq Ft
$104/Sq Ft
Est. Value
About This Home
This home is located at 3952 Ardmore Rd, Cleveland, OH 44121 and is currently estimated at $147,846, approximately $104 per square foot. 3952 Ardmore Rd is a home located in Cuyahoga County with nearby schools including Noble Elementary School, Monticello Middle School, and Cleveland Heights High School.
Ownership History
Date
Name
Owned For
Owner Type
Purchase Details
Closed on
Oct 29, 2009
Sold by
Estate Of Alan C Thomas
Bought by
Thomas Clara J
Current Estimated Value
Purchase Details
Closed on
Jun 26, 2002
Sold by
Thomas Alan C
Bought by
Thomas Alan C and Thomas Clara J
Home Financials for this Owner
Home Financials are based on the most recent Mortgage that was taken out on this home.
Original Mortgage
$63,100
Interest Rate
6.79%
Purchase Details
Closed on
Mar 17, 1989
Sold by
Conwell Robert L
Bought by
Thomas Alan C
Purchase Details
Closed on
Jan 20, 1984
Sold by
Stahl Ulf P
Bought by
Conwell Robert L
Purchase Details
Closed on
Oct 11, 1979
Sold by
Czyzak Michael J
Bought by
Stahl Ulf P
Purchase Details
Closed on
Mar 30, 1976
Sold by
Bell Edward S and A L
Bought by
Czyzak Michael J
Purchase Details
Closed on
Jan 1, 1975
Bought by
Bell Edward S and A L
Create a Home Valuation Report for This Property
The Home Valuation Report is an in-depth analysis detailing your home's value as well as a comparison with similar homes in the area
Home Values in the Area
Average Home Value in this Area
Purchase History
| Date | Buyer | Sale Price | Title Company |
|---|---|---|---|
| Thomas Clara J | -- | None Available | |
| Thomas Alan C | -- | Midland Title Security Inc | |
| Thomas Alan C | -- | Midland Title Security Inc | |
| Thomas Alan C | $52,000 | -- | |
| Conwell Robert L | $49,200 | -- | |
| Stahl Ulf P | $46,000 | -- | |
| Czyzak Michael J | $23,000 | -- | |
| Bell Edward S | -- | -- |
Source: Public Records
Mortgage History
| Date | Status | Borrower | Loan Amount |
|---|---|---|---|
| Previous Owner | Thomas Alan C | $63,100 |
Source: Public Records
Tax History Compared to Growth
Tax History
| Year | Tax Paid | Tax Assessment Tax Assessment Total Assessment is a certain percentage of the fair market value that is determined by local assessors to be the total taxable value of land and additions on the property. | Land | Improvement |
|---|---|---|---|---|
| 2024 | $3,722 | $53,445 | $9,520 | $43,925 |
| 2023 | $2,749 | $34,160 | $7,210 | $26,950 |
| 2022 | $2,779 | $34,160 | $7,210 | $26,950 |
| 2021 | $2,724 | $34,160 | $7,210 | $26,950 |
| 2020 | $2,617 | $30,800 | $6,510 | $24,290 |
| 2019 | $2,474 | $88,000 | $18,600 | $69,400 |
| 2018 | $2,559 | $30,800 | $6,510 | $24,290 |
| 2017 | $2,792 | $31,960 | $5,810 | $26,150 |
| 2016 | $2,786 | $31,960 | $5,810 | $26,150 |
| 2015 | $2,908 | $31,960 | $5,810 | $26,150 |
| 2014 | $2,908 | $34,380 | $6,270 | $28,110 |
Source: Public Records
Map
Nearby Homes
- 3983 Ardmore Rd
- 2884 Noble Rd
- 1292 Plainfield Rd
- 1356 Plainfield Rd
- 3861 Kirkwood Rd
- 3983 Elmwood Rd
- 3821 Montevista Rd
- 3817 Montevista Rd
- 1161 Pomona Rd
- 1157 Erieview Rd
- 1271 Winston Rd
- 1136 Erieview Rd
- 1148 Sylvania Rd
- 1231 Winston Rd
- 1268 Avondale Rd
- 3844 Woodridge Rd
- 1477 Genesee Rd
- 3837 Woodridge Rd
- 3923 Orchard Rd
- 1400 Avondale Rd
- 3948 Ardmore Rd
- 3960 Ardmore Rd
- 3964 Ardmore Rd
- 2841 Noble Rd
- 3968 Ardmore Rd
- 3953 Ardmore Rd
- 3959 Ardmore Rd
- 3951 Ardmore Rd
- 3972 Ardmore Rd
- 3967 Ardmore Rd
- 3947 Ardmore Rd
- 3971 Ardmore Rd
- 3978 Ardmore Rd
- 2833 Noble Rd
- 3975 Ardmore Rd
- 3982 Ardmore Rd
- 2825 Noble Rd
- 2866 Noble Rd
- 3956 Rosemond Rd
- 3952 Rosemond Rd