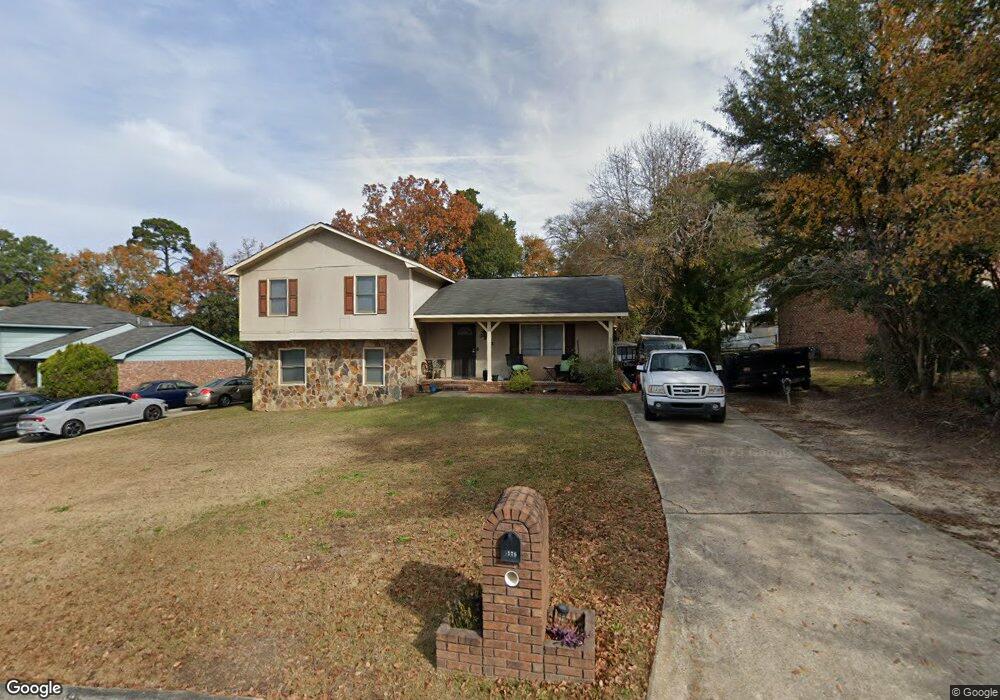
3953 Curry St Columbus, GA 31907
East Columbus NeighborhoodEstimated Value: $167,000 - $210,000
4
Beds
3
Baths
1,928
Sq Ft
$96/Sq Ft
Est. Value
About This Home
This home is located at 3953 Curry St, Columbus, GA 31907 and is currently estimated at $185,025, approximately $95 per square foot. 3953 Curry St is a home located in Muscogee County with nearby schools including Dimon Elementary School, Rothschild Leadership Academy, and Kendrick High School.
Ownership History
Date
Name
Owned For
Owner Type
Purchase Details
Closed on
Aug 24, 2018
Sold by
Elaine Ann Gilboy
Bought by
Kittrell John
Current Estimated Value
Home Financials for this Owner
Home Financials are based on the most recent Mortgage that was taken out on this home.
Original Mortgage
$9,100
Outstanding Balance
$7,905
Interest Rate
4.51%
Estimated Equity
$177,120
Purchase Details
Closed on
Nov 16, 2016
Sold by
Solomon Gale
Bought by
Kittrell John
Purchase Details
Closed on
Nov 26, 2013
Sold by
Jones Vincent
Bought by
Kittrell Gale Solomon
Home Financials for this Owner
Home Financials are based on the most recent Mortgage that was taken out on this home.
Original Mortgage
$97,696
Interest Rate
4.25%
Mortgage Type
FHA
Purchase Details
Closed on
Jun 13, 2012
Sold by
Citimortgage Inc
Bought by
Jones Vincent
Purchase Details
Closed on
May 16, 2012
Sold by
Citimortgage Inc
Bought by
Citimortgage Inc
Create a Home Valuation Report for This Property
The Home Valuation Report is an in-depth analysis detailing your home's value as well as a comparison with similar homes in the area
Home Values in the Area
Average Home Value in this Area
Purchase History
| Date | Buyer | Sale Price | Title Company |
|---|---|---|---|
| Kittrell John | $13,000 | -- | |
| Kittrell John | -- | -- | |
| Kittrell Gale Solomon | $99,500 | -- | |
| Jones Vincent | $60,000 | -- | |
| Citimortgage Inc | $76,493 | -- |
Source: Public Records
Mortgage History
| Date | Status | Borrower | Loan Amount |
|---|---|---|---|
| Open | Kittrell John | $9,100 | |
| Closed | Kittrell John | -- | |
| Previous Owner | Kittrell Gale Solomon | $97,696 |
Source: Public Records
Tax History
| Year | Tax Paid | Tax Assessment Tax Assessment Total Assessment is a certain percentage of the fair market value that is determined by local assessors to be the total taxable value of land and additions on the property. | Land | Improvement |
|---|---|---|---|---|
| 2025 | $100 | $58,744 | $6,004 | $52,740 |
| 2024 | $1,002 | $58,744 | $6,004 | $52,740 |
| 2023 | $314 | $58,744 | $6,004 | $52,740 |
| 2022 | $1,044 | $44,572 | $6,004 | $38,568 |
| 2021 | $1,037 | $38,800 | $6,004 | $32,796 |
| 2020 | $1,038 | $38,800 | $6,004 | $32,796 |
| 2019 | $1,043 | $38,800 | $6,004 | $32,796 |
| 2018 | $1,043 | $38,800 | $6,004 | $32,796 |
| 2017 | $0 | $38,800 | $6,004 | $32,796 |
| 2016 | $1,094 | $39,800 | $4,391 | $35,409 |
| 2015 | $1,096 | $39,800 | $4,391 | $35,409 |
| 2014 | $1,098 | $39,800 | $4,391 | $35,409 |
| 2013 | -- | $57,961 | $4,391 | $53,570 |
Source: Public Records
Map
Nearby Homes
- 3923 Curry St
- 559 Chandler Dr
- 229 N Oakley Dr
- 3589 Irwin Way
- 547 Fair Oaks Dr
- 275 Nightingale Dr
- 392 Olsen Ave
- 263 Nightingale Dr
- 240 Killdee Dr
- 391 & 401 Victoria Dr
- 4525 Sentry St
- 505 Parkchester Dr
- 827 Brighton Rd
- 3823 Ukraine Dr
- 417 Wickham Dr
- 4437 St Marys Rd
- 3400 Saint Marys Rd Unit 450
- 4516 Sims St
- 124 Whippoorwill Ln
- 4801 Allen St
- 3947 Curry St
- 3959 Curry St
- 3965 Curry St
- 3958 Woodford Dr
- 3958 Woodford Dr Unit 17
- 3964 Woodford Dr
- 3948 Curry St
- 3952 Curry St
- 3950 Woodford Dr
- 3944 Curry St
- 4001 Curry St
- 3946 Woodford Dr
- 465 Leary Ave
- 3940 Woodford Dr
- 4004 Woodford Dr
- 3940 Curry St
- 4000 Curry St
- 4007 Curry St
- 4014 Woodford Dr
- 3936 Curry St
Your Personal Tour Guide
Ask me questions while you tour the home.