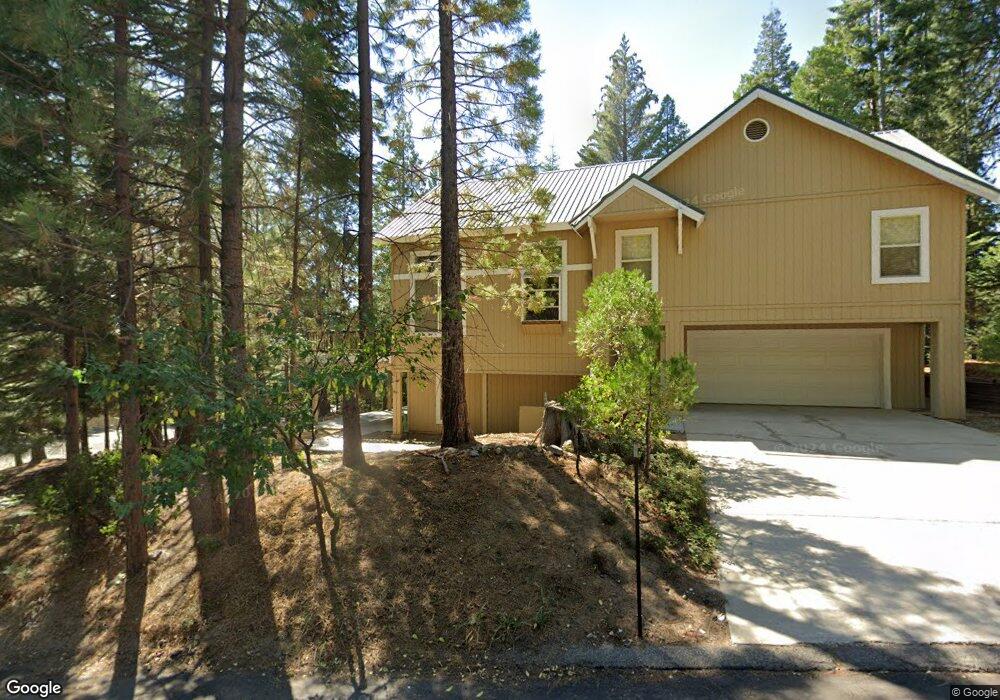
39538 Waterfall Ln Shaver Lake, CA 93664
Estimated Value: $683,294 - $804,000
3
Beds
3
Baths
2,309
Sq Ft
$323/Sq Ft
Est. Value
About This Home
This home is located at 39538 Waterfall Ln, Shaver Lake, CA 93664 and is currently estimated at $744,824, approximately $322 per square foot. 39538 Waterfall Ln is a home with nearby schools including Pine Ridge Elementary School.
Ownership History
Date
Name
Owned For
Owner Type
Purchase Details
Closed on
Aug 6, 2012
Sold by
Forester Thomas Gary and Forester Marilyn L
Bought by
Forester D D S T Gary and Forester Marilyn L
Current Estimated Value
Home Financials for this Owner
Home Financials are based on the most recent Mortgage that was taken out on this home.
Original Mortgage
$155,000
Outstanding Balance
$24,789
Interest Rate
3.62%
Mortgage Type
New Conventional
Estimated Equity
$720,035
Purchase Details
Closed on
Feb 11, 2002
Sold by
Forester T Gary and Forester Marilyn L
Bought by
Forester Dds T Gary and Forester Marilyn L
Purchase Details
Closed on
Jan 19, 1995
Sold by
Quiring Properties
Bought by
Forester Thomas Gary and Forester Marilyn L
Home Financials for this Owner
Home Financials are based on the most recent Mortgage that was taken out on this home.
Original Mortgage
$179,900
Interest Rate
9.21%
Mortgage Type
Purchase Money Mortgage
Create a Home Valuation Report for This Property
The Home Valuation Report is an in-depth analysis detailing your home's value as well as a comparison with similar homes in the area
Home Values in the Area
Average Home Value in this Area
Purchase History
| Date | Buyer | Sale Price | Title Company |
|---|---|---|---|
| Forester D D S T Gary | -- | Chicago Title Company | |
| Forester Thomas Gary | -- | Chicago Title Company | |
| Forester Dds T Gary | -- | -- | |
| Forester Thomas Gary | $225,000 | First American Title Ins Co |
Source: Public Records
Mortgage History
| Date | Status | Borrower | Loan Amount |
|---|---|---|---|
| Open | Forester Thomas Gary | $155,000 | |
| Closed | Forester Thomas Gary | $179,900 |
Source: Public Records
Tax History Compared to Growth
Tax History
| Year | Tax Paid | Tax Assessment Tax Assessment Total Assessment is a certain percentage of the fair market value that is determined by local assessors to be the total taxable value of land and additions on the property. | Land | Improvement |
|---|---|---|---|---|
| 2025 | $4,612 | $376,219 | $125,962 | $250,257 |
| 2023 | $4,526 | $361,612 | $121,072 | $240,540 |
| 2022 | $4,459 | $354,523 | $118,699 | $235,824 |
| 2021 | $4,334 | $347,572 | $116,372 | $231,200 |
| 2020 | $4,291 | $344,009 | $115,179 | $228,830 |
| 2019 | $4,265 | $337,265 | $112,921 | $224,344 |
| 2018 | $4,065 | $330,653 | $110,707 | $219,946 |
| 2017 | $3,993 | $324,171 | $108,537 | $215,634 |
| 2016 | $3,857 | $317,815 | $106,409 | $211,406 |
| 2015 | $3,792 | $313,042 | $104,811 | $208,231 |
| 2014 | $3,721 | $306,911 | $102,758 | $204,153 |
Source: Public Records
Map
Nearby Homes
- 39536 Musick Falls Rd
- 39567 Sunrock Ln
- 39553 Sunrock Ln Unit 27
- 39665 Sunset Rock Ln
- 40810 Oakwoods Ln
- 40812 Oakwoods Ln Unit 106
- 40828 Village Pass Ln
- 40780 Mill Run Ln
- 40798 Mill Run Ln Unit 20
- 40862 Village Pass Ln
- 40705 Sunset Vista Ln
- 40838 Village Pass Ln Unit 18
- 40662 Village Pass Ln
- 39801 Woody Ln
- 40607 Mill Run Ln Unit 72
- 40748 Mill Run Ln Unit 5
- 41031 Windwood Ln
- 41035 Cold Springs Ln
- 40922 Mill Run Ln
- 40814 Mill Run Ln
- 39536 Crest Point Ln
- 39584 Crest Point Ln
- 39 Crest Point Ln
- 0 Crest Point Ln
- 39606 Crest Point Ln
- 39519 Musick Falls Rd
- 39519 Musick Falls Ln
- 39527 Waterfall Ln
- 39537 Musick Falls Ln
- 39515 Waterfall Ln
- 39607 Crest Point Ln
- 39571 Crest Point Ln
- 39585 Crest Point Ln
- 39518 Crest Point Ln
- 39463 Musick Falls Rd
- 0 Musick Falls Ln
- 39553 Crest Point Ln
- 39638 Crest Point Ln
- 39490 Musick Falls Ln
- 39550 Musick Falls Ln