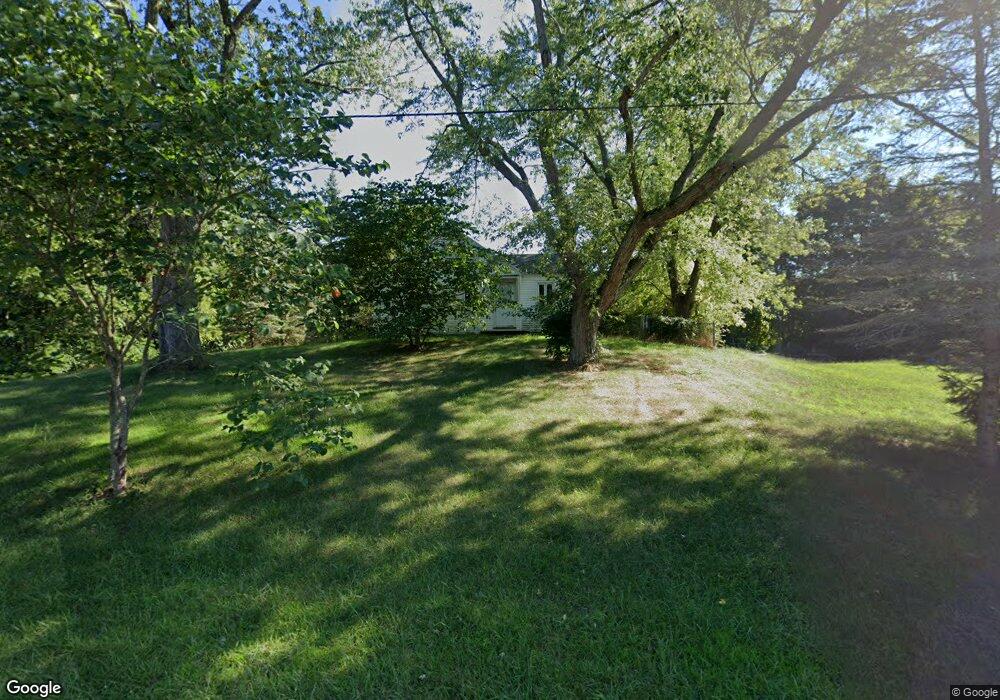
3954 Walnut St New Troy, MI 49119
Estimated Value: $127,000 - $190,058
2
Beds
1
Bath
875
Sq Ft
$193/Sq Ft
Est. Value
About This Home
This home is located at 3954 Walnut St, New Troy, MI 49119 and is currently estimated at $169,265, approximately $193 per square foot. 3954 Walnut St is a home located in Berrien County with nearby schools including River Valley Middle/High School and Trinity Lutheran School.
Ownership History
Date
Name
Owned For
Owner Type
Purchase Details
Closed on
Nov 17, 2012
Sold by
Schuler Michael J and Schuler Mantissa Joy
Bought by
Schuler Michael J and Schuler Mantissa Joy
Current Estimated Value
Home Financials for this Owner
Home Financials are based on the most recent Mortgage that was taken out on this home.
Original Mortgage
$93,409
Outstanding Balance
$64,517
Interest Rate
3.38%
Mortgage Type
FHA
Estimated Equity
$104,748
Purchase Details
Closed on
Jan 30, 2006
Sold by
Staniszewski Damon F and Staniszewski Jennifer
Bought by
Schuler Michael J
Home Financials for this Owner
Home Financials are based on the most recent Mortgage that was taken out on this home.
Original Mortgage
$106,331
Interest Rate
6.2%
Mortgage Type
FHA
Purchase Details
Closed on
Oct 13, 1999
Purchase Details
Closed on
Sep 30, 1999
Purchase Details
Closed on
Jan 25, 1999
Purchase Details
Closed on
Apr 27, 1998
Purchase Details
Closed on
Mar 11, 1977
Create a Home Valuation Report for This Property
The Home Valuation Report is an in-depth analysis detailing your home's value as well as a comparison with similar homes in the area
Purchase History
| Date | Buyer | Sale Price | Title Company |
|---|---|---|---|
| Schuler Michael J | -- | None Available | |
| Schuler Michael J | -- | None Available | |
| -- | $76,800 | -- | |
| -- | $69,300 | -- | |
| -- | $85,000 | -- | |
| -- | $100 | -- | |
| -- | $15,500 | -- |
Source: Public Records
Mortgage History
| Date | Status | Borrower | Loan Amount |
|---|---|---|---|
| Open | Schuler Michael J | $93,409 | |
| Closed | Schuler Michael J | $106,331 |
Source: Public Records
Tax History
| Year | Tax Paid | Tax Assessment Tax Assessment Total Assessment is a certain percentage of the fair market value that is determined by local assessors to be the total taxable value of land and additions on the property. | Land | Improvement |
|---|---|---|---|---|
| 2025 | $1,469 | $84,600 | $0 | $0 |
| 2024 | $518 | $81,800 | $0 | $0 |
| 2023 | $493 | $69,100 | $0 | $0 |
| 2022 | $469 | $52,500 | $0 | $0 |
| 2021 | $1,318 | $46,400 | $5,000 | $41,400 |
| 2020 | $1,313 | $47,200 | $0 | $0 |
| 2019 | $1,297 | $49,800 | $5,000 | $44,800 |
| 2018 | $1,318 | $49,800 | $0 | $0 |
| 2017 | $1,310 | $47,800 | $0 | $0 |
| 2016 | $789 | $44,500 | $0 | $0 |
| 2015 | $787 | $48,100 | $0 | $0 |
| 2014 | $409 | $41,300 | $0 | $0 |
Source: Public Records
Map
Nearby Homes
- 4509 Hanover Rd
- 3334 W Glendora Rd
- 210 W Wagner Rd
- 5650 Lily Ln
- 2362 Browntown Rd
- 12843 S Wolcott Ave
- 5935 Sawyer Rd
- 0 W Wagner Rd Unit 26000020
- 12435 Sandpiper Ln
- 6010 Migiel Ln
- 5831 Browntown Rd
- 0 Warren Woods Rd Unit 14.71
- 12980 Crestview Dr
- 12199 Linden Ave
- 13217 Three Oaks Rd
- 0 Warren Woods Rd
- 6490 E Chikaming
- 11545 Landon Rd
- 1294 W Glendora Rd
- 0 Tower Hill Rd Unit 26009354
- 3955 Pine St
- 3953 Walnut St
- 3953 Walnut St
- 13409 State St
- 3975 Pine St
- 13383 State St
- 13371 State St
- 13447 State St
- 3968 Pine St
- 3980 Walnut St
- 3980 Walnut St
- 13407 California Rd
- 13415 California Rd
- 3852 Glendora Rd
- 3824 Glendora Rd
- 3764 Glendora Rd
- 13467 State St
- 13485 State St
- 13000 California Rd
- 13383 State St
Your Personal Tour Guide
Ask me questions while you tour the home.