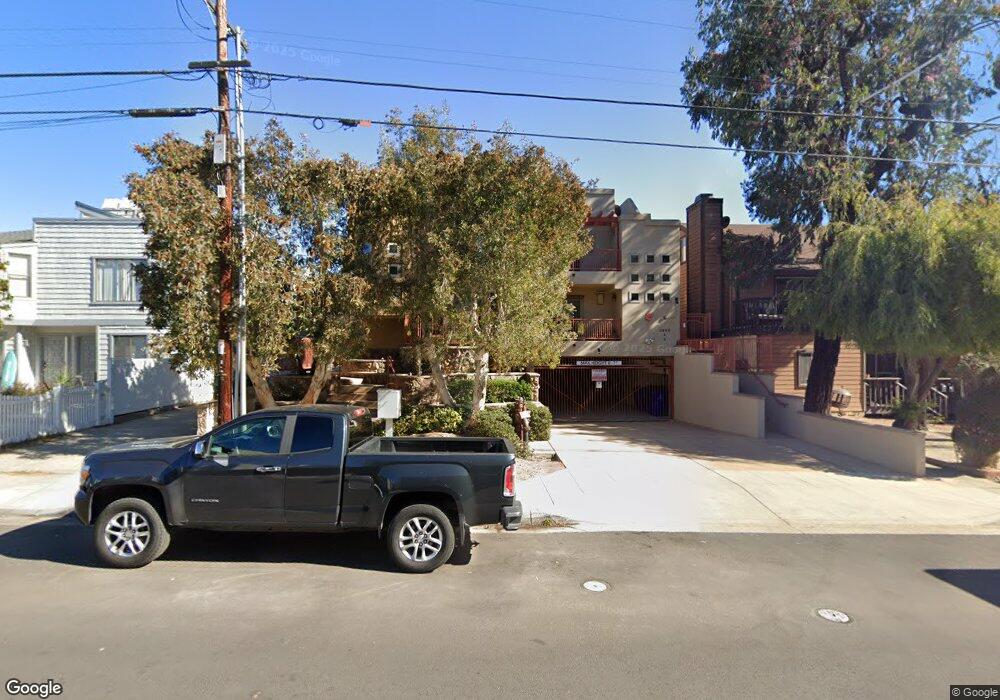
3955 Gresham St Unit 2 San Diego, CA 92109
Pacific Beach NeighborhoodEstimated Value: $1,377,000 - $1,487,000
3
Beds
3
Baths
1,469
Sq Ft
$969/Sq Ft
Est. Value
About This Home
This home is located at 3955 Gresham St Unit 2, San Diego, CA 92109 and is currently estimated at $1,422,983, approximately $968 per square foot. 3955 Gresham St Unit 2 is a home located in San Diego County with nearby schools including Crown Point Junior Music Academy, Pacific Beach Middle, and Mission Bay High School.
Ownership History
Date
Name
Owned For
Owner Type
Purchase Details
Closed on
Jul 31, 2015
Sold by
Herskovitz Stanley and Herskovitz Pamela
Bought by
Gillies Robert J and Mueller Jessica
Current Estimated Value
Home Financials for this Owner
Home Financials are based on the most recent Mortgage that was taken out on this home.
Original Mortgage
$525,000
Outstanding Balance
$412,066
Interest Rate
3.97%
Mortgage Type
New Conventional
Estimated Equity
$1,010,918
Purchase Details
Closed on
May 14, 2009
Sold by
Sail Bay Investments Llc
Bought by
Herskovitz Stanley and Herskovitz Pamela
Home Financials for this Owner
Home Financials are based on the most recent Mortgage that was taken out on this home.
Original Mortgage
$385,000
Interest Rate
4.83%
Mortgage Type
Purchase Money Mortgage
Create a Home Valuation Report for This Property
The Home Valuation Report is an in-depth analysis detailing your home's value as well as a comparison with similar homes in the area
Home Values in the Area
Average Home Value in this Area
Purchase History
| Date | Buyer | Sale Price | Title Company |
|---|---|---|---|
| Gillies Robert J | $775,000 | First American Title | |
| Mueller Jessica | -- | First American Title | |
| Gillies Robert J | -- | First American Title | |
| Herskovitz Stanley | $695,000 | Chicago Title Company |
Source: Public Records
Mortgage History
| Date | Status | Borrower | Loan Amount |
|---|---|---|---|
| Open | Gillies Robert J | $525,000 | |
| Previous Owner | Herskovitz Stanley | $385,000 |
Source: Public Records
Tax History
| Year | Tax Paid | Tax Assessment Tax Assessment Total Assessment is a certain percentage of the fair market value that is determined by local assessors to be the total taxable value of land and additions on the property. | Land | Improvement |
|---|---|---|---|---|
| 2025 | $11,078 | $917,435 | $540,582 | $376,853 |
| 2024 | $11,078 | $899,447 | $529,983 | $369,464 |
| 2023 | $10,748 | $881,812 | $519,592 | $362,220 |
| 2022 | $10,461 | $864,522 | $509,404 | $355,118 |
| 2021 | $10,388 | $847,571 | $499,416 | $348,155 |
| 2020 | $10,261 | $838,882 | $494,296 | $344,586 |
| 2019 | $10,076 | $822,434 | $484,604 | $337,830 |
| 2018 | $9,419 | $806,308 | $475,102 | $331,206 |
| 2017 | $9,194 | $790,499 | $465,787 | $324,712 |
| 2016 | $9,047 | $775,000 | $456,654 | $318,346 |
| 2015 | $7,663 | $650,000 | $383,000 | $267,000 |
| 2014 | -- | $600,000 | $354,000 | $246,000 |
Source: Public Records
Map
Nearby Homes
- 3940 Gresham St Unit 251
- 3940 Gresham St Unit 152
- 3923 Riviera Dr Unit A
- 3910 Haines St Unit 106
- 4069 Gresham St
- 4051 Fanuel St Unit 8
- 3901 Haines St
- 3905 Haines St
- 3903 Haines St
- 3850 Riviera Dr Unit 3B
- 4030 Promontory St
- 1251 Parker Place Unit 2N
- 1251 Parker Place Unit 2D
- 3828 Riviera Dr Unit 2B
- 1311 Pacific Beach Dr
- 1235 Parker Place Unit 3J
- 1235 Parker Place Unit 2B
- 1235 Parker Place Unit 2H
- 1418 Pacific Beach Dr
- 1254 Parker Place
- 3955 Gresham St Unit 4
- 3955 Gresham St Unit 3
- 3955 Gresham St Unit 1
- 3945 Gresham St
- 3963 Gresham St
- 3965 Gresham St
- 3967 Gresham St
- 3975 Gresham St
- 3937 Gresham St
- 3984 Riviera Dr
- 3982 Riviera Dr
- 3980 Riviera Dr
- 3978 Riviera Dr
- 3972 Riviera Dr Unit 1
- 3976 Riviera Dr
- 3974 Riviera Dr
- 3988 Riviera Dr
- 3988 Riviera Dr Unit D
- 3988 Riviera Dr Unit A
- 3988 Riviera Dr Unit B
Your Personal Tour Guide
Ask me questions while you tour the home.