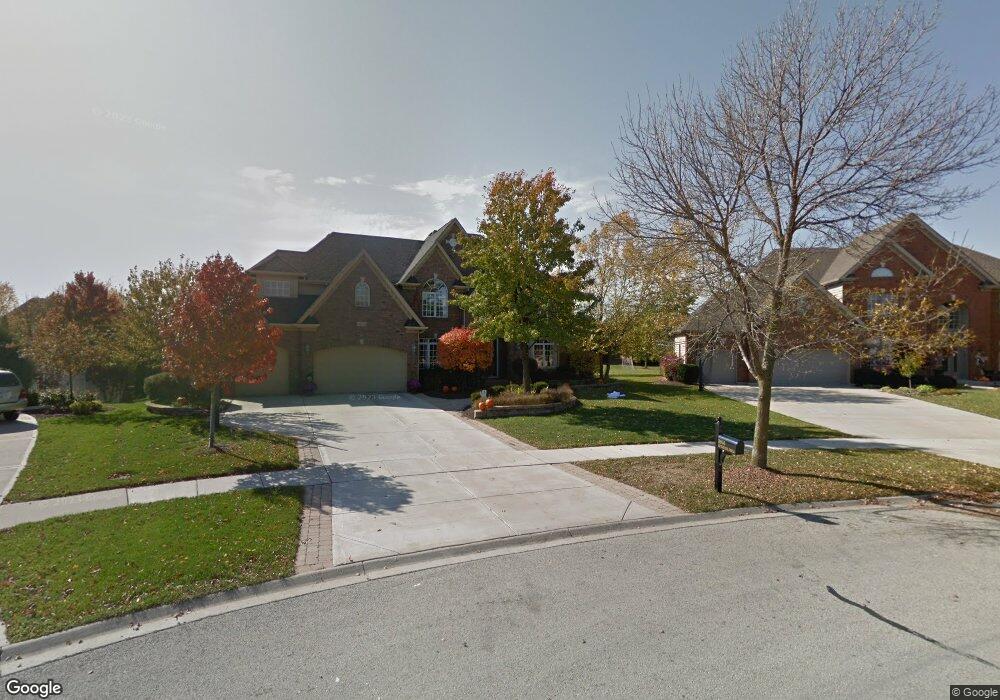
3955 Littlestone Cir Naperville, IL 60564
Tamarack NeighborhoodEstimated Value: $914,000 - $1,048,000
Studio
1
Bath
4,059
Sq Ft
$246/Sq Ft
Est. Value
About This Home
This home is located at 3955 Littlestone Cir, Naperville, IL 60564 and is currently estimated at $998,620, approximately $246 per square foot. 3955 Littlestone Cir is a home located in Will County with nearby schools including Danielle-Joy Peterson Elementary School, Clifford Crone Middle School, and Neuqua Valley High School.
Ownership History
Date
Name
Owned For
Owner Type
Purchase Details
Closed on
Nov 28, 2001
Sold by
Claybridge Builders Inc
Bought by
Sowske Mark E and Sowske Barbara J
Current Estimated Value
Home Financials for this Owner
Home Financials are based on the most recent Mortgage that was taken out on this home.
Original Mortgage
$565,300
Outstanding Balance
$213,013
Interest Rate
6.68%
Estimated Equity
$785,607
Purchase Details
Closed on
Jan 10, 2000
Sold by
The Macom Corp
Bought by
Claybridge Builders Inc
Home Financials for this Owner
Home Financials are based on the most recent Mortgage that was taken out on this home.
Original Mortgage
$339,920
Interest Rate
8.5%
Create a Home Valuation Report for This Property
The Home Valuation Report is an in-depth analysis detailing your home's value as well as a comparison with similar homes in the area
Home Values in the Area
Average Home Value in this Area
Purchase History
| Date | Buyer | Sale Price | Title Company |
|---|---|---|---|
| Sowske Mark E | $612,000 | First American Title | |
| Claybridge Builders Inc | $446,000 | -- |
Source: Public Records
Mortgage History
| Date | Status | Borrower | Loan Amount |
|---|---|---|---|
| Open | Sowske Mark E | $565,300 | |
| Previous Owner | Claybridge Builders Inc | $339,920 |
Source: Public Records
Tax History
| Year | Tax Paid | Tax Assessment Tax Assessment Total Assessment is a certain percentage of the fair market value that is determined by local assessors to be the total taxable value of land and additions on the property. | Land | Improvement |
|---|---|---|---|---|
| 2024 | $19,280 | $302,355 | $66,273 | $236,082 |
| 2023 | $19,280 | $267,098 | $58,545 | $208,553 |
| 2022 | $17,872 | $252,671 | $55,383 | $197,288 |
| 2021 | $17,091 | $240,639 | $52,746 | $187,893 |
| 2020 | $16,770 | $236,826 | $51,910 | $184,916 |
| 2019 | $16,488 | $230,152 | $50,447 | $179,705 |
| 2018 | $16,794 | $230,191 | $49,338 | $180,853 |
| 2017 | $16,543 | $224,248 | $48,064 | $176,184 |
| 2016 | $16,517 | $219,420 | $47,029 | $172,391 |
| 2015 | $15,062 | $210,981 | $45,220 | $165,761 |
| 2014 | $15,062 | $189,099 | $45,220 | $143,879 |
| 2013 | $15,062 | $189,099 | $45,220 | $143,879 |
Source: Public Records
Map
Nearby Homes
- 3907 Littlestone Cir
- 3712 Ryder Ct
- 11039 Royal Porthcawl Dr
- 4023 Juneberry Rd
- 4128 Callery Rd
- 24531 W 103rd St
- 11405 Glenbrook Cir
- 5332 Cedar Dr
- 4304 Champion Rd
- 3372 Fulshear Cir
- 3371 Fulshear Cir
- 3373 Fulshear Cir
- 3375 Fulshear Cir
- 3338 Fulshear Cir
- 3274 Mirehaven Ct
- 3284 Wildlight Rd
- 3273 Mirehaven Dr
- 3258 Mirehaven Ct
- 11616 Century Cir
- 3281 Wildlight Rd
- 3951 Littlestone Cir
- 3959 Littlestone Cir
- 3919 Royal Portrush Dr
- 3911 Royal Portrush Dr
- 3947 Littlestone Cir
- 3963 Littlestone Cir
- 3948 Littlestone Cir
- 3907 Royal Portrush Dr
- 3943 Littlestone Cir
- 3967 Littlestone Cir
- 3944 Littlestone Cir
- 3903 Royal Portrush Dr
- 3916 Royal Portrush Dr
- 3912 Royal Portrush Dr
- 3939 Littlestone Cir
- 3968 Littlestone Cir
- 3940 Littlestone Cir
- 4751 Sassafras Ln
- 3823 Royal Portrush Dr
- 4747 Sassafras Ln
Your Personal Tour Guide
Ask me questions while you tour the home.