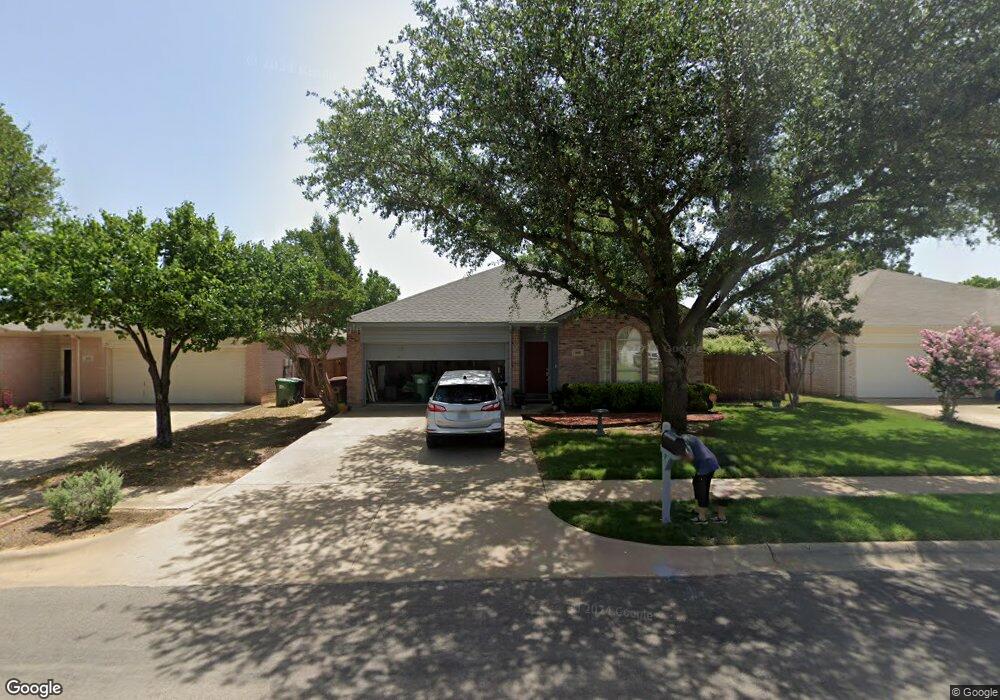
3957 Overlake Dr Denton, TX 76210
South Denton NeighborhoodEstimated Value: $306,566 - $313,000
3
Beds
2
Baths
1,508
Sq Ft
$206/Sq Ft
Est. Value
About This Home
This home is located at 3957 Overlake Dr, Denton, TX 76210 and is currently estimated at $310,642, approximately $205 per square foot. 3957 Overlake Dr is a home located in Denton County with nearby schools including Ryan Elementary School, Crownover Middle School, and Guyer High School.
Ownership History
Date
Name
Owned For
Owner Type
Purchase Details
Closed on
Feb 5, 2024
Sold by
Phillips Barbara J
Bought by
Phillips Barbara J and Phillips James P
Current Estimated Value
Home Financials for this Owner
Home Financials are based on the most recent Mortgage that was taken out on this home.
Original Mortgage
$182,000
Outstanding Balance
$178,425
Interest Rate
6.61%
Mortgage Type
Credit Line Revolving
Estimated Equity
$132,217
Purchase Details
Closed on
Apr 4, 2003
Sold by
Dubois Dana L
Bought by
Phillips Barbara J
Home Financials for this Owner
Home Financials are based on the most recent Mortgage that was taken out on this home.
Original Mortgage
$111,065
Interest Rate
5.71%
Purchase Details
Closed on
May 26, 1998
Sold by
Choice Homes Texas Inc
Bought by
Dubois Dana L
Home Financials for this Owner
Home Financials are based on the most recent Mortgage that was taken out on this home.
Original Mortgage
$74,280
Interest Rate
7.22%
Create a Home Valuation Report for This Property
The Home Valuation Report is an in-depth analysis detailing your home's value as well as a comparison with similar homes in the area
Home Values in the Area
Average Home Value in this Area
Purchase History
| Date | Buyer | Sale Price | Title Company |
|---|---|---|---|
| Phillips Barbara J | -- | None Listed On Document | |
| Phillips Barbara J | -- | -- | |
| Phillips Barbara J | -- | -- | |
| Dubois Dana L | -- | -- | |
| Dubois Dana L | -- | -- |
Source: Public Records
Mortgage History
| Date | Status | Borrower | Loan Amount |
|---|---|---|---|
| Open | Phillips Barbara J | $182,000 | |
| Previous Owner | Phillips Barbara J | $111,065 | |
| Previous Owner | Dubois Dana L | $74,280 |
Source: Public Records
Tax History Compared to Growth
Tax History
| Year | Tax Paid | Tax Assessment Tax Assessment Total Assessment is a certain percentage of the fair market value that is determined by local assessors to be the total taxable value of land and additions on the property. | Land | Improvement |
|---|---|---|---|---|
| 2025 | $885 | $320,122 | $66,003 | $259,897 |
| 2024 | $5,617 | $291,020 | $0 | $0 |
| 2023 | $885 | $264,564 | $66,003 | $263,011 |
| 2022 | $5,106 | $240,513 | $66,003 | $210,631 |
| 2021 | $4,861 | $232,846 | $46,502 | $186,344 |
| 2020 | $4,543 | $198,771 | $46,502 | $159,239 |
| 2019 | $4,312 | $180,701 | $46,502 | $159,668 |
| 2018 | $3,968 | $164,274 | $36,002 | $148,783 |
| 2017 | $3,691 | $149,340 | $28,801 | $128,946 |
| 2016 | $3,356 | $135,764 | $28,801 | $106,963 |
| 2015 | $2,038 | $134,963 | $28,801 | $106,162 |
| 2013 | -- | $114,387 | $22,801 | $91,586 |
Source: Public Records
Map
Nearby Homes
- 3933 Parkhaven Dr
- 2412 Miranda Place
- 1913 Pavilion Ln
- 4125 Colina Ave
- 4100 Fanita Place
- 2401 Creekdale Dr
- 2005 Creekdale Dr
- 4613 Bernstein Blvd
- Pizarro Plan at
- Kingsley Plan at
- 4017 Whisperwood Rd
- Addison Plan at
- 3900 Gessner Dr
- 5718 Green Ivy Rd
- 2112 Del Mar Ct
- 1517 Miranda Ln
- 2316 Del Mar Ct
- 3812 Gennaker Dr
- Flatiron Plan at Parkvue
- Waler Plan at Oakbridge Crossing
- 3953 Overlake Dr
- 3961 Overlake Dr
- 2301 Wildwood Ln
- 3949 Overlake Dr
- 2305 Wildwood Ln
- 3956 Overlake Dr
- 3952 Overlake Dr
- 3960 Overlake Dr
- 3945 Overlake Dr
- 3948 Overlake Dr
- 2224 Wildwood Ln
- 2309 Wildwood Ln
- 2220 Wildwood Ln
- 2300 Wildwood Ln
- 2216 Wildwood Ln
- 3944 Overlake Dr
- 2304 Wildwood Ln
- 3941 Overlake Dr
- 3957 Parkhaven Dr
- 3953 Parkhaven Dr