39579 Jones Rd Fallbrook, CA 92028
Estimated Value: $678,597 - $711,000
2
Beds
1
Bath
1,250
Sq Ft
$554/Sq Ft
Est. Value
About This Home
This home is located at 39579 Jones Rd, Fallbrook, CA 92028 and is currently estimated at $692,532, approximately $554 per square foot. 39579 Jones Rd is a home located in San Diego County with nearby schools including William H. Frazier Elementary School, James E. Potter Intermediate School, and Fallbrook High School.
Ownership History
Date
Name
Owned For
Owner Type
Purchase Details
Closed on
Oct 4, 2021
Sold by
Wright Howard M and Wright Shauna L
Bought by
Wright Trust and Wright
Current Estimated Value
Purchase Details
Closed on
Jun 12, 2014
Sold by
Wright Howard M
Bought by
Wright Howard M and Wright Shauna L
Purchase Details
Closed on
Jun 14, 2010
Sold by
Schultheis Elsie H
Bought by
Wright Howard M and Schultheis Elsie H
Purchase Details
Closed on
Feb 2, 2009
Sold by
Schultheis Elsie H and Wright Howard M
Bought by
Schultheis Elsie H
Purchase Details
Closed on
Mar 4, 1994
Sold by
Schultheis Gary R
Bought by
Schultheis Gary R
Home Financials for this Owner
Home Financials are based on the most recent Mortgage that was taken out on this home.
Original Mortgage
$141,000
Interest Rate
5.5%
Purchase Details
Closed on
Dec 7, 1993
Sold by
Erickson Schultheis Lori M
Bought by
Schultheis Gary R
Purchase Details
Closed on
Jul 10, 1989
Create a Home Valuation Report for This Property
The Home Valuation Report is an in-depth analysis detailing your home's value as well as a comparison with similar homes in the area
Purchase History
| Date | Buyer | Sale Price | Title Company |
|---|---|---|---|
| Wright Trust | -- | None Listed On Document | |
| Wright Howard M | -- | None Available | |
| Wright Howard M | -- | None Available | |
| Schultheis Elsie H | -- | None Available | |
| Schultheis Gary R | -- | United Title Company | |
| Schultheis Gary R | -- | -- | |
| -- | $107,000 | -- |
Source: Public Records
Mortgage History
| Date | Status | Borrower | Loan Amount |
|---|---|---|---|
| Previous Owner | Schultheis Gary R | $141,000 |
Source: Public Records
Tax History
| Year | Tax Paid | Tax Assessment Tax Assessment Total Assessment is a certain percentage of the fair market value that is determined by local assessors to be the total taxable value of land and additions on the property. | Land | Improvement |
|---|---|---|---|---|
| 2025 | $3,951 | $345,402 | $226,084 | $119,318 |
| 2024 | $3,951 | $338,630 | $221,651 | $116,979 |
| 2023 | $3,945 | $331,991 | $217,305 | $114,686 |
| 2022 | $3,946 | $325,483 | $213,045 | $112,438 |
| 2021 | $3,827 | $319,102 | $208,868 | $110,234 |
| 2020 | $3,853 | $315,831 | $206,727 | $109,104 |
| 2019 | $3,785 | $309,639 | $202,674 | $106,965 |
| 2018 | $3,734 | $303,568 | $198,700 | $104,868 |
| 2017 | $751 | $297,616 | $194,804 | $102,812 |
| 2016 | $3,587 | $291,782 | $190,985 | $100,797 |
| 2015 | $3,536 | $287,400 | $188,117 | $99,283 |
| 2014 | $3,478 | $281,772 | $184,433 | $97,339 |
Source: Public Records
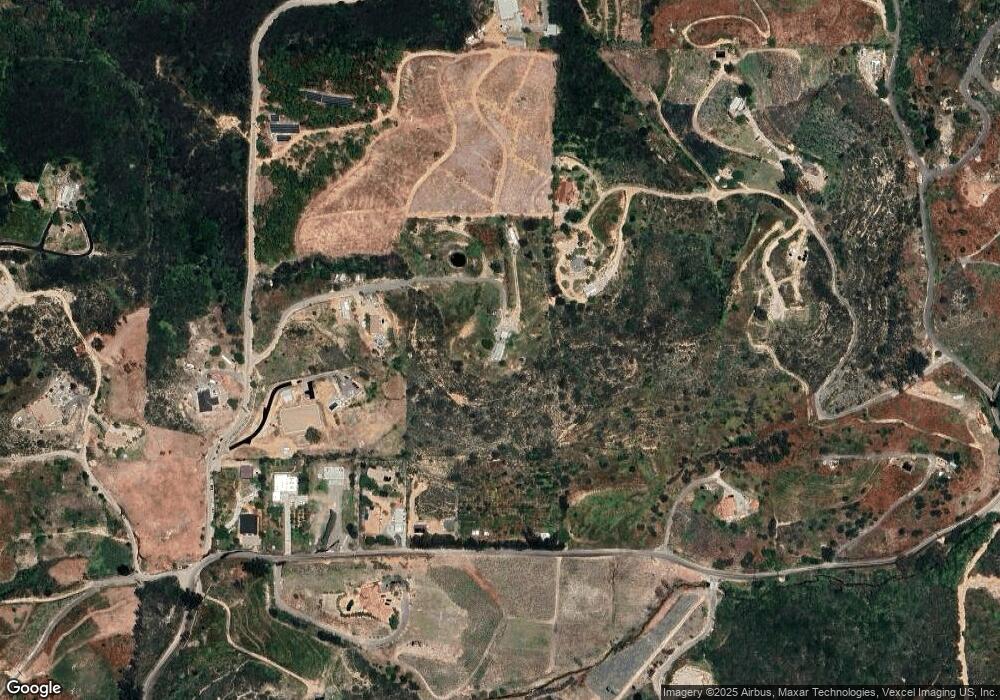
Map
Nearby Homes
- 39939 Jones Rd
- 39182 Daily Rd
- 2366 Green Valley Rd
- 2620 Mar Vinga Ln
- 2339 Green Valley Rd
- 1 Daily Rd
- 2494 Donnil Ln
- 40390 Ross Rd
- 40057 S Shore Rd
- 41322 De Luz Rd
- 0 Supale Ranch Rd
- 38149 De Luz Rd
- 0 De Luz Murrieta Rd Unit NDP2600299
- 48980 De Luz Rd
- 38083 De Luz Rd
- 2 Daneri Ln
- 3 Daneri Ln
- 0 Crumley Ct
- 6 Crumley Ct
- 5 Crumley Ct
- 39537 Jones Rd
- 39571 Jones Rd
- 39542 Daily Rd
- 39550 Jones Rd
- 39521 Jones Rd
- 39570 Daily Rd
- 39511 Daily Rd
- 39501 Daily Rd
- 39555 Calle de Luz
- 39499 Daily Rd
- 2251 Glenn Rd
- 16.12 ac Daily Rd
- / Calle de Luz
- 2384 Glenn Rd
- 3.17 ac Daily Rd
- 39575 Calle de Luz
- 39681 Calle de Luz
- 0000 Glenn Rd
- 39673 Calle de Luz
- 39758 Daily Rd
Your Personal Tour Guide
Ask me questions while you tour the home.