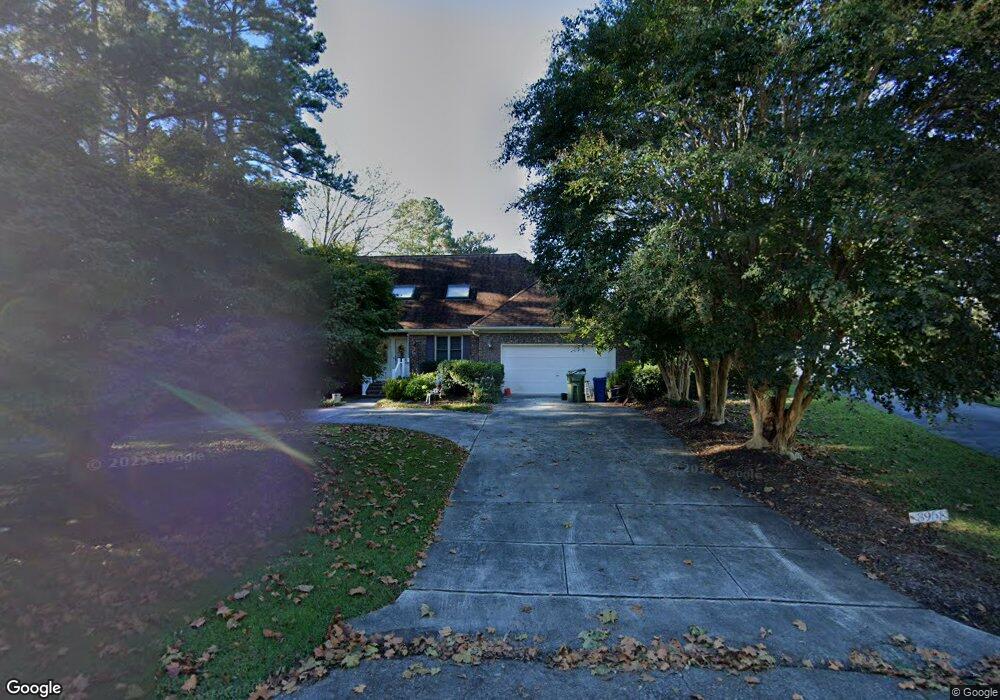
3958 Appleton Way Wilmington, NC 28412
Echo Farms-Rivers Edge NeighborhoodEstimated Value: $607,237 - $708,000
4
Beds
3
Baths
2,635
Sq Ft
$247/Sq Ft
Est. Value
About This Home
This home is located at 3958 Appleton Way, Wilmington, NC 28412 and is currently estimated at $650,559, approximately $246 per square foot. 3958 Appleton Way is a home located in New Hanover County with nearby schools including Edwin A. Alderman Elementary School, Williston Middle School, and New Hanover High School.
Ownership History
Date
Name
Owned For
Owner Type
Purchase Details
Closed on
Aug 16, 1999
Sold by
Belden John Sally
Bought by
Reid Bradley Wayne Deborah M
Current Estimated Value
Purchase Details
Closed on
Aug 1, 1988
Sold by
Smith Davie R Sharon L
Bought by
Belden John Sally
Purchase Details
Closed on
Jul 1, 1987
Sold by
Plaza Associates Inc Etal
Bought by
Smith Davie R Sharon L
Purchase Details
Closed on
Apr 1, 1985
Sold by
Plaza Associates Inc Etal
Bought by
Plaza Associates Inc Etal
Purchase Details
Closed on
Nov 1, 1984
Sold by
Wilm Homes Inc
Bought by
Suggs & Harrelson Inc
Purchase Details
Closed on
Jun 1, 1981
Sold by
Terry and Cribb Builders In
Bought by
Wilm Homes Inc
Purchase Details
Closed on
May 1, 1980
Bought by
Terry and Cribb Builders In
Create a Home Valuation Report for This Property
The Home Valuation Report is an in-depth analysis detailing your home's value as well as a comparison with similar homes in the area
Home Values in the Area
Average Home Value in this Area
Purchase History
| Date | Buyer | Sale Price | Title Company |
|---|---|---|---|
| Reid Bradley Wayne Deborah M | $253,000 | -- | |
| Belden John Sally | $137,500 | -- | |
| Smith Davie R Sharon L | $19,000 | -- | |
| Plaza Associates Inc Etal | -- | -- | |
| Plaza Associates Inc Etal | $340,000 | -- | |
| Suggs & Harrelson Inc | -- | -- | |
| Wilm Homes Inc | $1,000,000 | -- | |
| Wilm Homes Inc | -- | -- | |
| Terry | -- | -- |
Source: Public Records
Tax History Compared to Growth
Tax History
| Year | Tax Paid | Tax Assessment Tax Assessment Total Assessment is a certain percentage of the fair market value that is determined by local assessors to be the total taxable value of land and additions on the property. | Land | Improvement |
|---|---|---|---|---|
| 2025 | $3,590 | $610,000 | $139,200 | $470,800 |
| 2023 | $1,537 | $363,900 | $83,700 | $280,200 |
| 2022 | $2,320 | $363,900 | $83,700 | $280,200 |
| 2021 | $779 | $363,900 | $83,700 | $280,200 |
| 2020 | $3,215 | $305,200 | $71,400 | $233,800 |
| 2019 | $3,215 | $305,200 | $71,400 | $233,800 |
| 2018 | $1,607 | $305,200 | $71,400 | $233,800 |
| 2017 | $3,215 | $305,200 | $71,400 | $233,800 |
| 2016 | $3,212 | $289,900 | $71,400 | $218,500 |
| 2015 | $3,070 | $289,900 | $71,400 | $218,500 |
| 2014 | $2,940 | $289,900 | $71,400 | $218,500 |
Source: Public Records
Map
Nearby Homes
- 4031 Appleton Way
- 1114 Mccarley Blvd
- 305 Saint Annes Moor
- 3721 Sand Trap Ct
- 3970 Echo Farms Blvd
- 3932 Echo Farms Blvd
- 3236 Penzance Row
- 3908 River Front Place Unit 201
- 4158 Breezewood Dr Unit 203
- 3241 Penzance Row
- 1012 Balfoure Dr
- 4156 Breezewood Dr Unit 102
- 1006 Ryans Ct
- 3806 Echo Farms Blvd
- 108 Hedingham Ct
- 3802 River Front Place Unit 204
- 215 Valencia Ct Unit 305
- 1137 Island Cove
- 318 Hedingham Ln
- 206 Hibiscus Way
- 3954 Appleton Way
- 3962 Appleton Way
- 3950 Appleton Way
- 3953 Appleton Way
- 3959 Appleton Way
- 3965 Appleton Way
- 3965 Appleton Way Unit 1
- 3946 Appleton Way
- 4004 Crofton Place
- 4008 Crofton Place
- 212 Savoy Cir
- 3943 Appleton Way
- 4014 Crofton Place
- 1000 Mccarley Blvd Unit Lot 17
- 4014 N Crofton Place
- 509 Windchime Dr
- 4307 Densiflorum Ct
- 4311 Densiflorum Ct
- 505 Windchime Dr
- 4002 Appleton Way