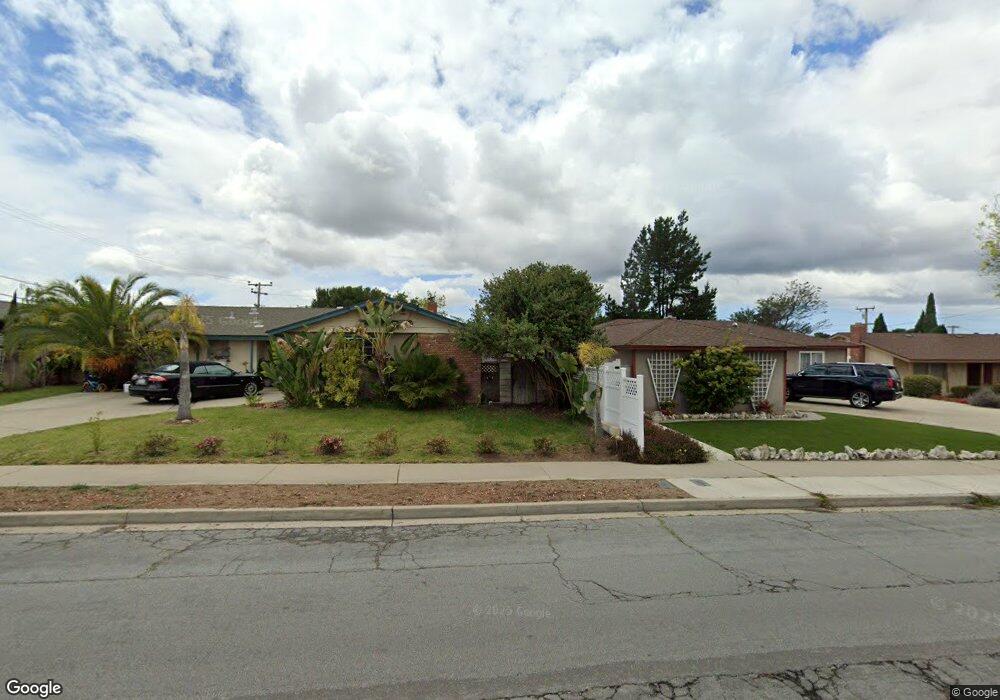
3958 Mesa Circle Dr Unit 3 Lompoc, CA 93436
Estimated Value: $447,000 - $466,000
2
Beds
2
Baths
1,238
Sq Ft
$367/Sq Ft
Est. Value
About This Home
This home is located at 3958 Mesa Circle Dr Unit 3, Lompoc, CA 93436 and is currently estimated at $454,062, approximately $366 per square foot. 3958 Mesa Circle Dr Unit 3 is a home located in Santa Barbara County with nearby schools including Buena Vista Elementary School, Cabrillo High School, and Olive Grove Charter - Lompoc.
Ownership History
Date
Name
Owned For
Owner Type
Purchase Details
Closed on
Feb 24, 2025
Sold by
Dierkens Kara Kay
Bought by
Dierkens Family Trust and Dierkens
Current Estimated Value
Purchase Details
Closed on
Oct 18, 2024
Sold by
David And Sandra Lemon Family Trust and Lemon Kyle Worthington
Bought by
Dierkens Kara Kay
Purchase Details
Closed on
Jan 12, 2017
Sold by
Lemon Sandra
Bought by
Lemon David G and Lemon Sandra W
Purchase Details
Closed on
Feb 28, 2005
Sold by
First National Bk & Tr Co Mountain Home
Bought by
Worthington Virginia
Purchase Details
Closed on
Aug 25, 2000
Sold by
Katherine Schneider and Katherine Susanne Hooks
Bought by
First National Bk & Tr Co Of Mountain Home
Create a Home Valuation Report for This Property
The Home Valuation Report is an in-depth analysis detailing your home's value as well as a comparison with similar homes in the area
Home Values in the Area
Average Home Value in this Area
Purchase History
| Date | Buyer | Sale Price | Title Company |
|---|---|---|---|
| Dierkens Family Trust | -- | None Listed On Document | |
| Dierkens Kara Kay | -- | None Listed On Document | |
| Lemon David G | -- | None Available | |
| Worthington Virginia | -- | -- | |
| First National Bk & Tr Co Of Mountain Home | $141,500 | First American Title | |
| Schneider Kathrine | -- | First American Title |
Source: Public Records
Tax History
| Year | Tax Paid | Tax Assessment Tax Assessment Total Assessment is a certain percentage of the fair market value that is determined by local assessors to be the total taxable value of land and additions on the property. | Land | Improvement |
|---|---|---|---|---|
| 2025 | $2,667 | $377,400 | $102,000 | $275,400 |
| 2023 | $2,667 | $204,918 | $65,164 | $139,754 |
| 2022 | $2,628 | $200,901 | $63,887 | $137,014 |
| 2021 | $2,655 | $196,963 | $62,635 | $134,328 |
| 2020 | $2,630 | $194,944 | $61,993 | $132,951 |
| 2019 | $2,594 | $191,123 | $60,778 | $130,345 |
| 2018 | $2,559 | $187,377 | $59,587 | $127,790 |
| 2017 | $2,429 | $183,704 | $58,419 | $125,285 |
| 2016 | $2,037 | $180,103 | $57,274 | $122,829 |
| 2014 | $1,992 | $173,924 | $55,309 | $118,615 |
Source: Public Records
Map
Nearby Homes
- 3939 Mesa Circle Dr
- 3916 Mesa Circle Dr Unit A
- 113 Gemini Ave
- 4447 Falcon Dr
- 3825 Saturn Ave Unit 1
- 666 Carina Dr
- 250 Saint Andrews Way
- 18 Galaxy Way
- 6 Stanford Cir
- 3843 Cassini Cir Unit 3
- 4166 Oakwood Ct
- 4173 Oakwood Ct
- 73 Stanford Cir
- 3725 Jupiter Ave
- 549 Palomar Cir
- 731 Voyager Rd
- 728 Pluto Ave
- 372 Oak Hill Dr
- 384 Falcon Crest Dr
- 649 Burning Tree Way
- 3956 Mesa Circle Dr
- 3990 Sirius Ave
- 3980 Sirius Ave Unit 2
- 4010 Sirius Ave
- 4050 Sirius Ave
- 3952 Mesa Circle Dr
- 3952 Mesa Circle Dr Unit 3
- 3954 Mesa Circle Dr
- 3954 Mesa Circle Dr Unit 3
- 4080 Sirius Ave
- 294 Altair Ave
- 3952 Mesa Cir Dr
- 295 Antares Ave
- 295 Altair Ave
- 3986 Mesa Circle Dr
- 3986 Mesa Circle Dr Unit 214
- 294 Aldebaran Ave
Your Personal Tour Guide
Ask me questions while you tour the home.