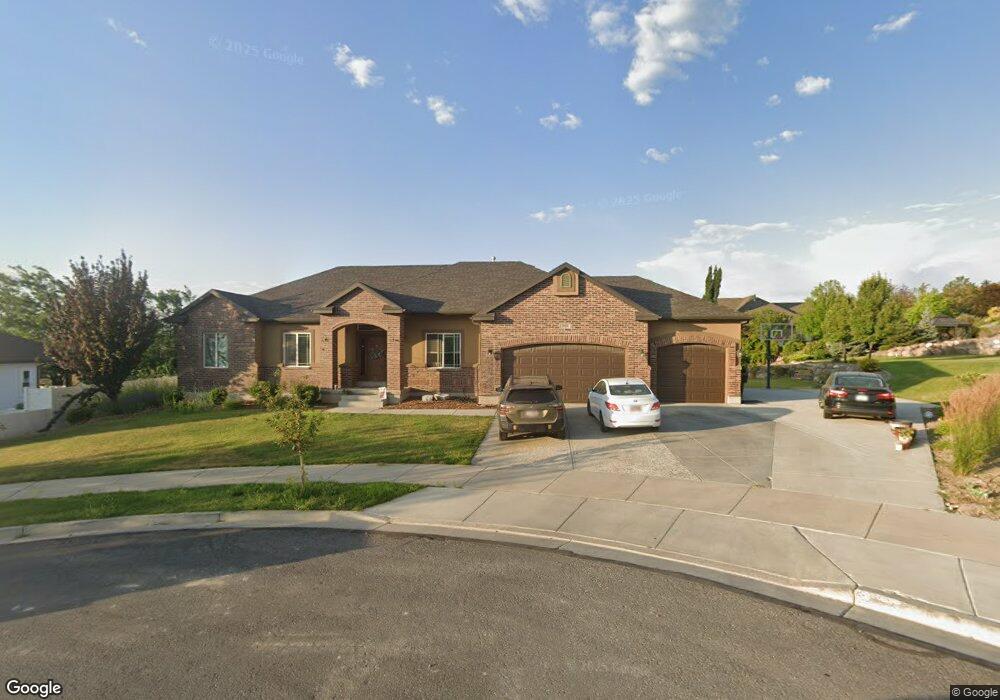
3959 Bethpage Ct South Jordan, UT 84095
Oquirrh Park NeighborhoodEstimated Value: $665,000 - $822,508
3
Beds
3
Baths
1,798
Sq Ft
$413/Sq Ft
Est. Value
About This Home
This home is located at 3959 Bethpage Ct, South Jordan, UT 84095 and is currently estimated at $742,377, approximately $412 per square foot. 3959 Bethpage Ct is a home located in Salt Lake County with nearby schools including Eastlake Elementary School, Elk Ridge Middle School, and Mountain West Montessori Academy.
Ownership History
Date
Name
Owned For
Owner Type
Purchase Details
Closed on
Dec 17, 2024
Sold by
Caton And Michelle Hanson Living Trust and Hanson Caton
Bought by
Cmh Bethpage Llc
Current Estimated Value
Purchase Details
Closed on
Jan 23, 2017
Sold by
Matagi Tara
Bought by
Matagi Justin
Purchase Details
Closed on
Aug 29, 2011
Sold by
Morris Shevin and Morris Yolanda
Bought by
Matagi Justin and Matagi Tara
Home Financials for this Owner
Home Financials are based on the most recent Mortgage that was taken out on this home.
Original Mortgage
$258,282
Interest Rate
4.46%
Mortgage Type
FHA
Purchase Details
Closed on
Mar 11, 2011
Sold by
Morris Shevin L and Morris Yolanda C
Bought by
Morris Shevin L and Morris Yolanda C
Home Financials for this Owner
Home Financials are based on the most recent Mortgage that was taken out on this home.
Original Mortgage
$250,985
Interest Rate
4.77%
Mortgage Type
FHA
Purchase Details
Closed on
Nov 29, 2010
Sold by
Morris Shevin and Morris Yolanda
Bought by
Morris Shevin L and Morris Yolanda C
Home Financials for this Owner
Home Financials are based on the most recent Mortgage that was taken out on this home.
Original Mortgage
$120,650
Interest Rate
4.16%
Mortgage Type
Construction
Purchase Details
Closed on
Oct 13, 2010
Sold by
Flagstar Bank Fsb
Bought by
Morris Shevin and Morris Yolanda
Home Financials for this Owner
Home Financials are based on the most recent Mortgage that was taken out on this home.
Original Mortgage
$120,650
Interest Rate
4.16%
Mortgage Type
Construction
Purchase Details
Closed on
Jun 14, 2010
Sold by
Ott Chris J
Bought by
Flagstar Bank Fsb
Purchase Details
Closed on
Jan 2, 2007
Sold by
Boyer Jordan Heights Lc
Bought by
Ott Chris J
Home Financials for this Owner
Home Financials are based on the most recent Mortgage that was taken out on this home.
Original Mortgage
$224,750
Interest Rate
6.22%
Mortgage Type
Purchase Money Mortgage
Create a Home Valuation Report for This Property
The Home Valuation Report is an in-depth analysis detailing your home's value as well as a comparison with similar homes in the area
Home Values in the Area
Average Home Value in this Area
Purchase History
| Date | Buyer | Sale Price | Title Company |
|---|---|---|---|
| Cmh Bethpage Llc | -- | None Listed On Document | |
| Matagi Justin | -- | None Available | |
| Matagi Justin | -- | Cornerstone Title Ins Agcy L | |
| Morris Shevin L | -- | Metro National Title | |
| Morris Shevin L | -- | Affiliated First Title | |
| Morris Shevin | -- | Integrated Title Ins Svcs | |
| Flagstar Bank Fsb | $92,000 | Etitle Insurance Agency | |
| Ott Chris J | -- | Landmark Title |
Source: Public Records
Mortgage History
| Date | Status | Borrower | Loan Amount |
|---|---|---|---|
| Previous Owner | Matagi Justin | $258,282 | |
| Previous Owner | Morris Shevin L | $250,985 | |
| Previous Owner | Morris Shevin L | $120,650 | |
| Previous Owner | Ott Chris J | $224,750 |
Source: Public Records
Tax History Compared to Growth
Tax History
| Year | Tax Paid | Tax Assessment Tax Assessment Total Assessment is a certain percentage of the fair market value that is determined by local assessors to be the total taxable value of land and additions on the property. | Land | Improvement |
|---|---|---|---|---|
| 2025 | $3,813 | $782,400 | $266,200 | $516,200 |
| 2024 | $3,813 | $723,900 | $266,900 | $457,000 |
| 2023 | $3,792 | $679,300 | $259,100 | $420,200 |
| 2022 | $3,906 | $685,800 | $254,000 | $431,800 |
| 2021 | $3,104 | $500,100 | $210,000 | $290,100 |
| 2020 | $3,077 | $464,600 | $210,000 | $254,600 |
| 2019 | $3,034 | $450,400 | $198,700 | $251,700 |
| 2018 | $2,877 | $424,900 | $197,600 | $227,300 |
| 2017 | $2,821 | $408,300 | $194,200 | $214,100 |
| 2016 | $2,849 | $390,800 | $179,500 | $211,300 |
| 2015 | $2,774 | $369,900 | $181,200 | $188,700 |
| 2014 | $2,665 | $349,300 | $172,700 | $176,600 |
Source: Public Records
Map
Nearby Homes
- 11029 Hampton Way Unit 156
- 3907 W Tottori Dune Dr
- 10984 S Nellis Dune Ct
- 10988 S Greenvale Ct
- 3884 Sand Lake Dr
- 10934 Little Sahara Dr
- 10941 Little Sahara Dr
- Princeton Plan at High Pointe
- Sheridan Plan at High Pointe
- Dashell Plan at High Pointe
- Dakota Plan at High Pointe
- Olympus Plan at High Pointe
- Sweetwater Plan at High Pointe
- Roosevelt Plan at High Pointe
- Witzel Plan at High Pointe
- 10918 Little Sahara Dr Unit 1001
- 10963 S Coastal Dune Dr
- 10896 S Poplar Brook Place
- 10931 S Glamis Dune Dr
- 10984 Manitou Way
- 3959 Bethpage Ct Unit 106
- 3959 W Bethpage Ct Unit 106
- 3959 W Bethpage Ct Unit 106
- 3959 W Bethpage Ct
- 3962 Farmingdale Ct
- 3962 W Farmingdale Ct Unit 113
- 3962 W Farmingdale Ct
- 3947 Bethpage Ct
- 3947 W Bethpage Ct
- 3946 Farmingdale Ct
- 3962 W Bethpage Ct
- 3962 W Bethpage Ct Unit 105
- 3962 W Bethpage Ct Unit 105
- 3946 W Farmingdale Ct Unit 112
- 3946 W Farmingdale Ct
- 3958 W Bethpage Ct Unit 1
- 3958 W Bethpage Ct Unit 104
- 3958 W Bethpage Ct
- 3958 Bethpage Ct
- 3942 W Bethpage Ct Unit 103