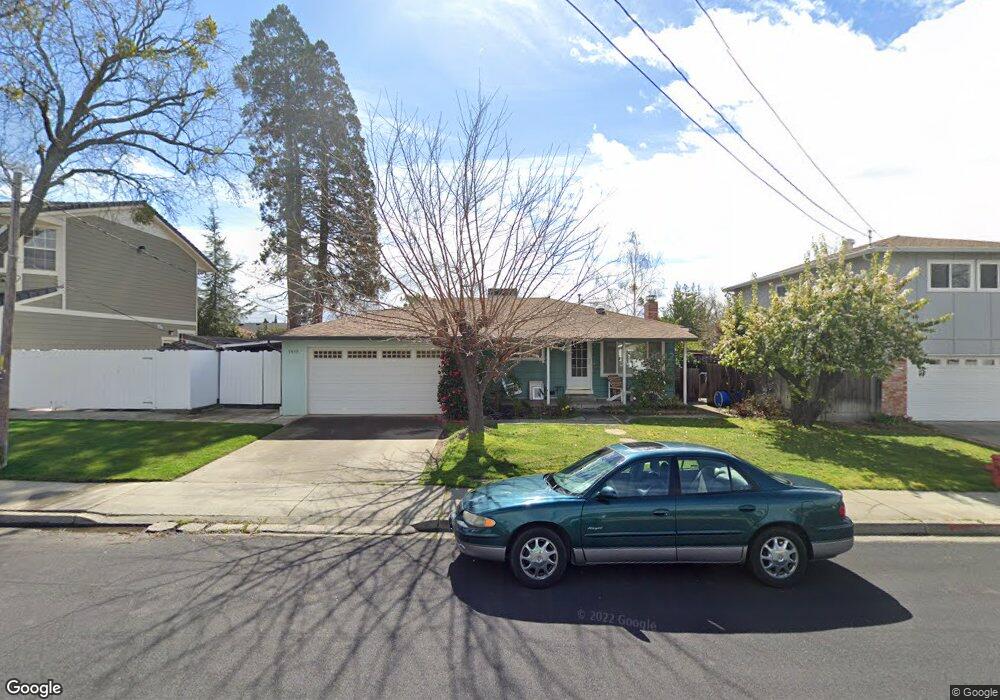
3959 Dartmouth Way Livermore, CA 94550
Jensen NeighborhoodEstimated Value: $929,000 - $1,075,000
3
Beds
2
Baths
1,766
Sq Ft
$576/Sq Ft
Est. Value
About This Home
This home is located at 3959 Dartmouth Way, Livermore, CA 94550 and is currently estimated at $1,016,462, approximately $575 per square foot. 3959 Dartmouth Way is a home located in Alameda County with nearby schools including Jackson Avenue Elementary School, East Avenue Middle School, and Livermore High School.
Ownership History
Date
Name
Owned For
Owner Type
Purchase Details
Closed on
Oct 31, 2024
Sold by
Runkel Michael J and Runkel Terry L
Bought by
Runkel Family Trust and Runkel
Current Estimated Value
Purchase Details
Closed on
Sep 22, 1994
Sold by
Montesanti Richard C
Bought by
Runkel Michael J and Runkel Terry L
Home Financials for this Owner
Home Financials are based on the most recent Mortgage that was taken out on this home.
Original Mortgage
$155,600
Interest Rate
8.58%
Purchase Details
Closed on
Dec 15, 1993
Sold by
Brown Paula A Montesanti
Bought by
Montesanti Richard C
Home Financials for this Owner
Home Financials are based on the most recent Mortgage that was taken out on this home.
Original Mortgage
$174,000
Interest Rate
4.37%
Create a Home Valuation Report for This Property
The Home Valuation Report is an in-depth analysis detailing your home's value as well as a comparison with similar homes in the area
Home Values in the Area
Average Home Value in this Area
Purchase History
| Date | Buyer | Sale Price | Title Company |
|---|---|---|---|
| Runkel Family Trust | -- | None Listed On Document | |
| Runkel Michael J | $194,500 | Golden Bay Title Company | |
| Montesanti Richard C | -- | First American Title |
Source: Public Records
Mortgage History
| Date | Status | Borrower | Loan Amount |
|---|---|---|---|
| Previous Owner | Runkel Michael J | $155,600 | |
| Previous Owner | Montesanti Richard C | $174,000 |
Source: Public Records
Tax History Compared to Growth
Tax History
| Year | Tax Paid | Tax Assessment Tax Assessment Total Assessment is a certain percentage of the fair market value that is determined by local assessors to be the total taxable value of land and additions on the property. | Land | Improvement |
|---|---|---|---|---|
| 2025 | $5,042 | $350,155 | $98,089 | $259,066 |
| 2024 | $5,042 | $343,153 | $96,166 | $253,987 |
| 2023 | $4,953 | $343,288 | $94,280 | $249,008 |
| 2022 | $4,868 | $329,559 | $92,432 | $244,127 |
| 2021 | $4,016 | $322,961 | $90,620 | $239,341 |
| 2020 | $4,609 | $326,578 | $89,691 | $236,887 |
| 2019 | $4,617 | $320,175 | $87,932 | $232,243 |
| 2018 | $4,505 | $313,897 | $86,208 | $227,689 |
| 2017 | $4,380 | $307,744 | $84,518 | $223,226 |
| 2016 | $4,202 | $301,712 | $82,862 | $218,850 |
| 2015 | $3,950 | $297,180 | $81,617 | $215,563 |
| 2014 | $3,877 | $291,361 | $80,019 | $211,342 |
Source: Public Records
Map
Nearby Homes
- 3959 Purdue Way
- 3992 Yale Way
- 202 Sonia Way
- 596 Tyler Ave
- 564 Tyler Ave
- 736 Adams Ave
- 3971 Portola Common Unit 1
- 3734 Carrigan Common
- 3370 Gardella Plaza
- 2908 Worthing Common
- 953 Wynn Cir
- 4674 Kimberley Common
- 713 Tennyson Dr
- 4844 Mulqueeney Common
- 905 S Livermore Ave
- 2845 Briarwood Dr
- 513 Briarwood Ct
- 4715 Marengo Common
- 4711 Marengo Common
- 4803 Andrea Ct
- 3951 Dartmouth Way
- 3967 Dartmouth Way
- 363 Burgess St
- 3966 Pestana Way
- 3958 Pestana Way
- 3943 Dartmouth Way
- 3974 Pestana Way
- 3950 Pestana Way
- 327 Burgess St
- 3952 Dartmouth Way
- 3944 Dartmouth Way
- 3942 Pestana Way
- 315 Burgess St
- 350 Burgess St
- 362 Burgess St
- 3940 Dartmouth Way
- 3961 Santa Clara Way
- 3963 Pestana Way
- 3927 Dartmouth Way
- 338 Burgess St