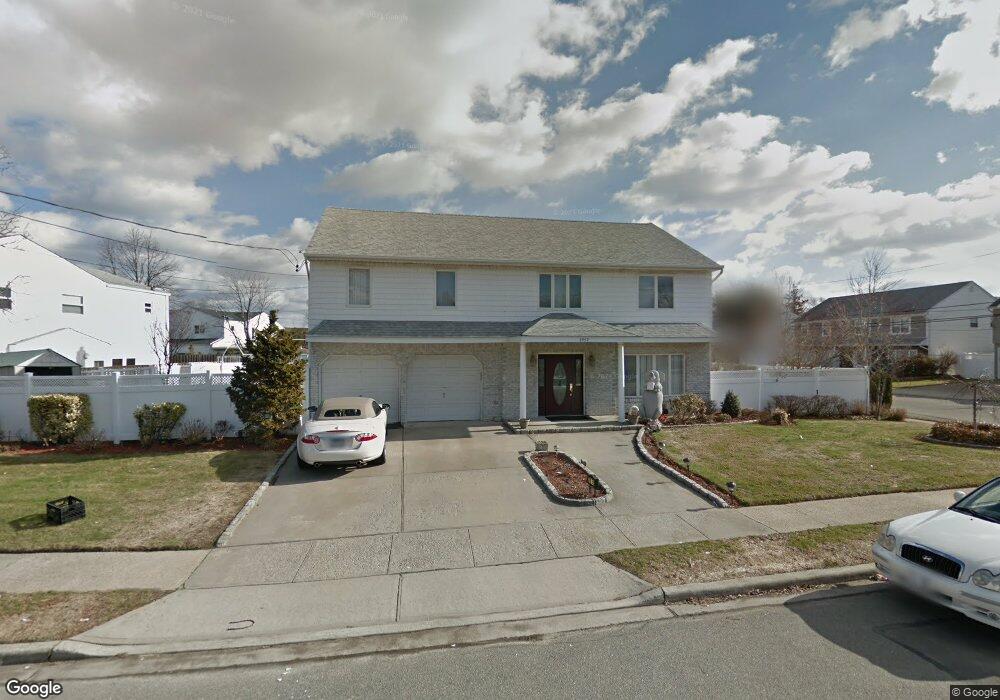
3959 Sally Ln Oceanside, NY 11572
Estimated Value: $1,040,902 - $1,103,000
4
Beds
3
Baths
2,706
Sq Ft
$396/Sq Ft
Est. Value
About This Home
This home is located at 3959 Sally Ln, Oceanside, NY 11572 and is currently estimated at $1,071,951, approximately $396 per square foot. 3959 Sally Ln is a home located in Nassau County with nearby schools including Boardman Elementary School, Oceanside Middle School, and Oceanside High School.
Ownership History
Date
Name
Owned For
Owner Type
Purchase Details
Closed on
Jul 7, 2021
Sold by
Fellin Cynthia
Bought by
Sheriff Ryan and Barden Sheriff Pamela
Current Estimated Value
Home Financials for this Owner
Home Financials are based on the most recent Mortgage that was taken out on this home.
Original Mortgage
$500,000
Outstanding Balance
$454,088
Interest Rate
2.96%
Mortgage Type
New Conventional
Estimated Equity
$617,863
Create a Home Valuation Report for This Property
The Home Valuation Report is an in-depth analysis detailing your home's value as well as a comparison with similar homes in the area
Home Values in the Area
Average Home Value in this Area
Purchase History
| Date | Buyer | Sale Price | Title Company |
|---|---|---|---|
| Sheriff Ryan | $849,000 | None Available |
Source: Public Records
Mortgage History
| Date | Status | Borrower | Loan Amount |
|---|---|---|---|
| Open | Sheriff Ryan | $500,000 |
Source: Public Records
Tax History
| Year | Tax Paid | Tax Assessment Tax Assessment Total Assessment is a certain percentage of the fair market value that is determined by local assessors to be the total taxable value of land and additions on the property. | Land | Improvement |
|---|---|---|---|---|
| 2025 | $17,424 | $631 | $241 | $390 |
| 2024 | $4,990 | $635 | $243 | $392 |
Source: Public Records
Map
Nearby Homes
- 94 Jeffery Ln
- 24 Strangford Ct
- 0 Nevada Ave
- 512 Links Dr E
- 405 Club Ct
- 487 Links Dr E
- 210 Saratoga Blvd
- 4081 Massachusetts Ave
- 348 Links Dr E
- 3461 Ocean Ave
- 163 Mott St
- 3452 Ocean Ave
- 3530 Long Beach Rd Unit 44
- 3451 3rd St
- 100 Daly Blvd Unit 1402
- 100 Daly Blvd Unit 2410
- 100 Daly Blvd Unit 2713
- 100 Daly Blvd Unit 2103
- 25 Alhambra Dr
- 3391 Fairway Rd
Your Personal Tour Guide
Ask me questions while you tour the home.