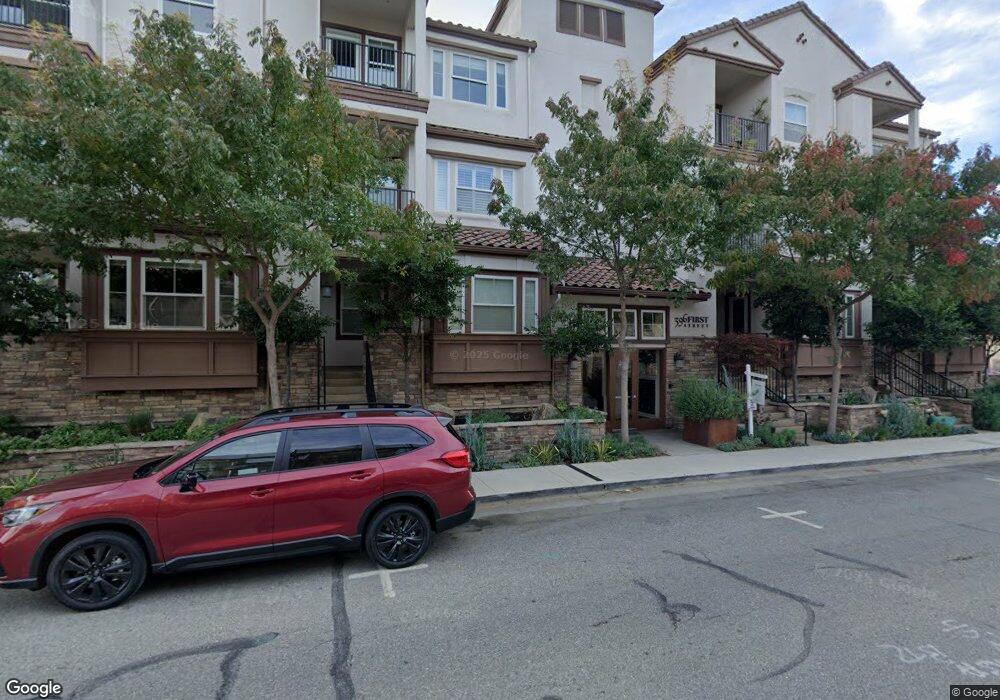
396 1st St Unit 4 Los Altos, CA 94022
Estimated Value: $1,072,794 - $1,747,000
1
Bed
1
Bath
891
Sq Ft
$1,606/Sq Ft
Est. Value
About This Home
This home is located at 396 1st St Unit 4, Los Altos, CA 94022 and is currently estimated at $1,431,199, approximately $1,606 per square foot. 396 1st St Unit 4 is a home located in Santa Clara County with nearby schools including Gardner Bullis Elementary School, Ardis G. Egan Junior High School, and Los Altos High School.
Ownership History
Date
Name
Owned For
Owner Type
Purchase Details
Closed on
Jul 1, 2024
Sold by
Chen Brenda
Bought by
Chen Clayton Chi-Hung
Current Estimated Value
Purchase Details
Closed on
Aug 12, 2013
Sold by
Lennar Homes Of California Inc
Bought by
396 First Los Altos Llc
Home Financials for this Owner
Home Financials are based on the most recent Mortgage that was taken out on this home.
Original Mortgage
$660,000
Interest Rate
4.33%
Mortgage Type
Purchase Money Mortgage
Purchase Details
Closed on
Apr 23, 2013
Sold by
Lennar Homes Of California Inc
Bought by
Sangoi Hiren and Dedhia Aditi
Home Financials for this Owner
Home Financials are based on the most recent Mortgage that was taken out on this home.
Original Mortgage
$614,618
Interest Rate
3.48%
Mortgage Type
New Conventional
Create a Home Valuation Report for This Property
The Home Valuation Report is an in-depth analysis detailing your home's value as well as a comparison with similar homes in the area
Home Values in the Area
Average Home Value in this Area
Purchase History
| Date | Buyer | Sale Price | Title Company |
|---|---|---|---|
| Chen Clayton Chi-Hung | -- | None Listed On Document | |
| 396 First Los Altos Llc | -- | North American Title Company | |
| Sangoi Hiren | $768,500 | North American Title Company |
Source: Public Records
Mortgage History
| Date | Status | Borrower | Loan Amount |
|---|---|---|---|
| Previous Owner | 396 First Los Altos Llc | $660,000 | |
| Previous Owner | Sangoi Hiren | $614,618 |
Source: Public Records
Tax History
| Year | Tax Paid | Tax Assessment Tax Assessment Total Assessment is a certain percentage of the fair market value that is determined by local assessors to be the total taxable value of land and additions on the property. | Land | Improvement |
|---|---|---|---|---|
| 2025 | $12,027 | $946,057 | $473,028 | $473,029 |
| 2024 | $12,027 | $927,507 | $463,753 | $463,754 |
| 2023 | $12,027 | $909,321 | $454,660 | $454,661 |
| 2022 | $11,845 | $891,493 | $445,746 | $445,747 |
| 2021 | $11,685 | $874,013 | $437,006 | $437,007 |
| 2020 | $11,754 | $865,053 | $432,526 | $432,527 |
| 2019 | $11,232 | $848,093 | $424,046 | $424,047 |
| 2018 | $11,135 | $831,465 | $415,732 | $415,733 |
| 2017 | $10,720 | $815,163 | $407,581 | $407,582 |
| 2016 | $10,448 | $799,181 | $399,590 | $399,591 |
| 2015 | $10,281 | $787,177 | $393,588 | $393,589 |
| 2014 | $10,098 | $771,759 | $385,879 | $385,880 |
Source: Public Records
Map
Nearby Homes
- 425 1st St Unit 14
- 389 1st St Unit 31
- 450 1st St Unit 204
- 450 1st St Unit 202
- 450 1st St Unit 107
- 62 Cuesta Dr
- 522 Tyndall St
- 128 Cuesta Dr Unit 5
- 130 Lyell St
- 416 Gabilan St
- 486 Gabilan St Unit 2
- 709 Orange Ave
- 655 Washington St
- 106 2nd St
- 101 2nd St Unit 5
- 26 4th St Unit 9
- 38 3rd St Unit 309
- 16 4th St
- 100 1st St Unit 307
- 1 W Edith Ave Unit A101
- 396 1st St Unit 16
- 396 1st St Unit 13
- 396 1st St
- 396 1st St Unit 1
- 396 1st St Unit 19
- 396 1st St Unit 2
- 396 1st St Unit 7
- 425 1st St Unit 25
- 425 1st St Unit 11
- 425 1st St Unit 32
- 425 1st St Unit 13
- 425 1st St Unit 22
- 425 1st St Unit 12
- 425 1st St Unit 35
- 440 1st St
- 389 1st St
- 389 1st St Unit 30
- 389 1st St Unit 24
- 389 1st St Unit 21
- 389 1st St Unit 20
Your Personal Tour Guide
Ask me questions while you tour the home.