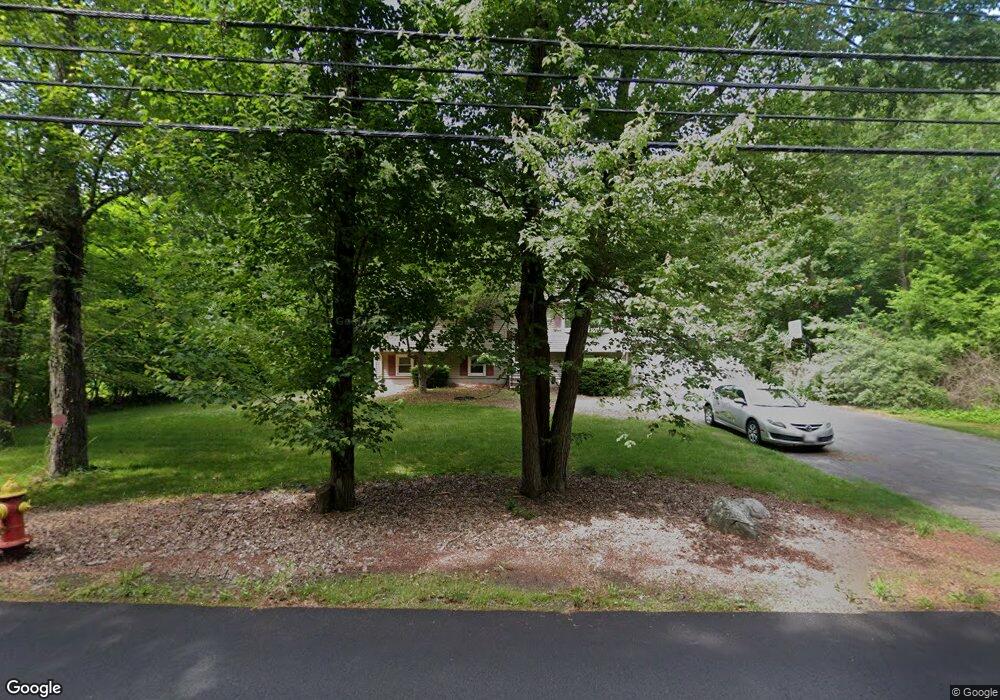
396 Branch St Mansfield, MA 02048
Estimated Value: $647,376 - $665,000
4
Beds
2
Baths
1,080
Sq Ft
$609/Sq Ft
Est. Value
About This Home
This home is located at 396 Branch St, Mansfield, MA 02048 and is currently estimated at $657,594, approximately $608 per square foot. 396 Branch St is a home located in Bristol County with nearby schools including Everett W. Robinson Elementary School, Jordan/Jackson Elementary School, and Harold L. Qualters Middle School.
Ownership History
Date
Name
Owned For
Owner Type
Purchase Details
Closed on
Jul 1, 1999
Sold by
Katz Gerald P and Katz Cynthia E
Bought by
Goodale William H
Current Estimated Value
Create a Home Valuation Report for This Property
The Home Valuation Report is an in-depth analysis detailing your home's value as well as a comparison with similar homes in the area
Home Values in the Area
Average Home Value in this Area
Purchase History
| Date | Buyer | Sale Price | Title Company |
|---|---|---|---|
| Goodale William H | $182,500 | -- |
Source: Public Records
Mortgage History
| Date | Status | Borrower | Loan Amount |
|---|---|---|---|
| Open | Goodale William H | $230,000 | |
| Closed | Goodale William H | $204,000 |
Source: Public Records
Tax History
| Year | Tax Paid | Tax Assessment Tax Assessment Total Assessment is a certain percentage of the fair market value that is determined by local assessors to be the total taxable value of land and additions on the property. | Land | Improvement |
|---|---|---|---|---|
| 2025 | $7,236 | $549,400 | $242,000 | $307,400 |
| 2024 | $6,812 | $504,600 | $242,000 | $262,600 |
| 2023 | $6,642 | $471,400 | $242,000 | $229,400 |
| 2022 | $6,428 | $423,700 | $224,000 | $199,700 |
| 2021 | $6,003 | $390,800 | $196,100 | $194,700 |
| 2020 | $5,938 | $386,600 | $186,800 | $199,800 |
| 2019 | $5,517 | $362,500 | $155,500 | $207,000 |
| 2018 | $2,064 | $339,600 | $148,300 | $191,300 |
| 2017 | $5,090 | $338,900 | $144,100 | $194,800 |
| 2016 | $5,034 | $326,700 | $137,200 | $189,500 |
| 2015 | $4,659 | $300,600 | $137,200 | $163,400 |
Source: Public Records
Map
Nearby Homes
- 7 Fieldstone Dr
- 1 Deer Path Ln
- 14 Windchime Dr
- 97 East St
- 46 Hope St
- 2 N Main St Unit B201
- 122 Samoset Ave
- 28 Court St
- 107 Church St
- 631 East St Unit L101
- 212 Mill St
- 22 Pleasant St Unit B
- 19 Barberry Rd
- 25 Kingman Ave
- 16 Holly Rd
- 4 Erick Rd Unit 90
- 166 Chauncy St
- 28 Angell St
- 619 N Main St
- 7 Liberty St
Your Personal Tour Guide
Ask me questions while you tour the home.