Estimated Value: $468,000 - $497,567
3
Beds
2
Baths
1,612
Sq Ft
$299/Sq Ft
Est. Value
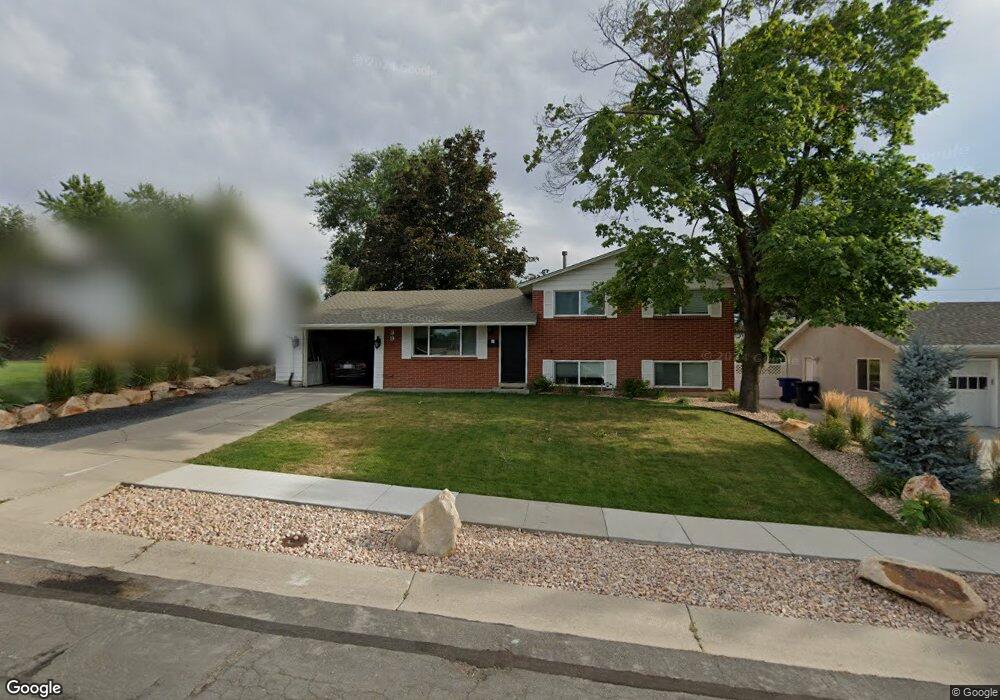
About This Home
This home is located at 396 E 8260 S, Sandy, UT 84070 and is currently estimated at $481,392, approximately $298 per square foot. 396 E 8260 S is a home located in Salt Lake County with nearby schools including Midvalley Elementary School, Union Middle School, and Hillcrest High School.
Ownership History
Date
Name
Owned For
Owner Type
Purchase Details
Closed on
Sep 23, 2021
Sold by
Westover Michael B
Bought by
Webb Joseph and Zenger Chloe
Current Estimated Value
Purchase Details
Closed on
Aug 20, 2018
Sold by
Westover Michael B
Bought by
Westover Michael
Home Financials for this Owner
Home Financials are based on the most recent Mortgage that was taken out on this home.
Original Mortgage
$55,000
Interest Rate
4.5%
Mortgage Type
New Conventional
Create a Home Valuation Report for This Property
The Home Valuation Report is an in-depth analysis detailing your home's value as well as a comparison with similar homes in the area
Home Values in the Area
Average Home Value in this Area
Purchase History
| Date | Buyer | Sale Price | Title Company |
|---|---|---|---|
| Webb Joseph | -- | Vanguard Title Union Park | |
| Westover Michael | -- | Metro National Title |
Source: Public Records
Mortgage History
| Date | Status | Borrower | Loan Amount |
|---|---|---|---|
| Previous Owner | Westover Michael | $55,000 |
Source: Public Records
Tax History
| Year | Tax Paid | Tax Assessment Tax Assessment Total Assessment is a certain percentage of the fair market value that is determined by local assessors to be the total taxable value of land and additions on the property. | Land | Improvement |
|---|---|---|---|---|
| 2025 | $2,432 | $456,400 | $128,500 | $327,900 |
| 2024 | $2,432 | $449,200 | $120,800 | $328,400 |
| 2023 | $2,212 | $407,400 | $114,800 | $292,600 |
| 2022 | $2,319 | $417,700 | $112,600 | $305,100 |
| 2021 | $2,054 | $314,300 | $97,900 | $216,400 |
| 2020 | $1,958 | $282,800 | $79,300 | $203,500 |
| 2019 | $1,826 | $256,800 | $79,300 | $177,500 |
| 2016 | $1,797 | $204,300 | $70,500 | $133,800 |
Source: Public Records
Map
Nearby Homes
- 8260 S 560 E
- 8322 S Levine Ln Unit 111
- 359 E 8400 S
- 274 E Water Mill Way Unit 230
- 8087 S 615 E
- 257 Water Mill Way Unit 211
- 8459 S 300 E
- 257 E Water Mill Way
- 393 E Corral Creek Dr
- 227 E St Germain Way
- 379 E Horse Creek Dr
- 144 E Chambord Ct
- 140 E Chambord Ct
- 138 E Chambord Ct
- 136 E Chambord Ct
- 132 E Chambord Ct
- 8278 S Resaca Dr Unit L1
- 8264 S Resaca Dr Unit K9
- 744 E 8425 S
- 117 E Calbourne Ln Unit I4
Your Personal Tour Guide
Ask me questions while you tour the home.