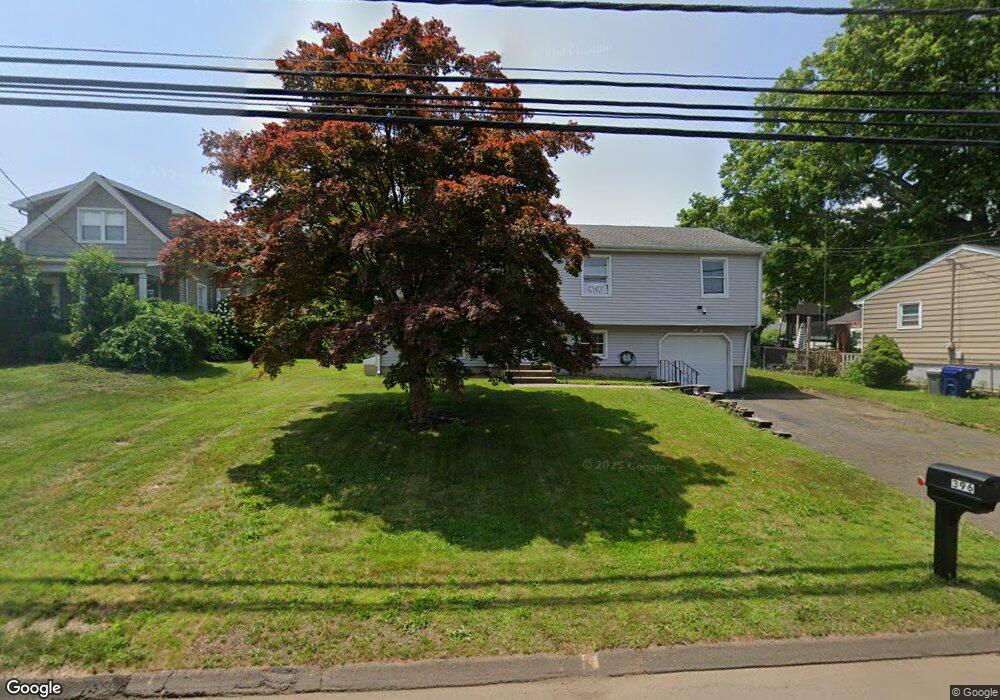
396 Platt Ave West Haven, CT 06516
West Shore NeighborhoodEstimated Value: $426,983 - $500,000
4
Beds
7
Baths
1,566
Sq Ft
$294/Sq Ft
Est. Value
About This Home
This home is located at 396 Platt Ave, West Haven, CT 06516 and is currently estimated at $460,746, approximately $294 per square foot. 396 Platt Ave is a home located in New Haven County with nearby schools including Carrigan 5/6 Intermediate School, Harry M. Bailey Middle School, and West Haven High School.
Ownership History
Date
Name
Owned For
Owner Type
Purchase Details
Closed on
Nov 30, 2010
Sold by
Luanci Const Llc
Bought by
Brown Marcus E
Current Estimated Value
Home Financials for this Owner
Home Financials are based on the most recent Mortgage that was taken out on this home.
Original Mortgage
$227,401
Outstanding Balance
$150,469
Interest Rate
4.25%
Mortgage Type
Purchase Money Mortgage
Estimated Equity
$310,277
Purchase Details
Closed on
Aug 18, 2009
Sold by
Deutsche Bk Natl T Co
Bought by
Luanei Construction Ll
Purchase Details
Closed on
Jul 10, 2009
Sold by
Hoff Edward R and Argent Mortgage Co Llc
Bought by
Argent Mortgage Co Llc
Purchase Details
Closed on
Jan 30, 2004
Sold by
Son Mooney C
Bought by
Hoff Edward R
Purchase Details
Closed on
Jun 16, 1999
Sold by
Valente Jean V
Bought by
Son Chumcosol and Pong Me
Create a Home Valuation Report for This Property
The Home Valuation Report is an in-depth analysis detailing your home's value as well as a comparison with similar homes in the area
Home Values in the Area
Average Home Value in this Area
Purchase History
| Date | Buyer | Sale Price | Title Company |
|---|---|---|---|
| Brown Marcus E | $237,000 | -- | |
| Luanei Construction Ll | $109,900 | -- | |
| Argent Mortgage Co Llc | -- | -- | |
| Hoff Edward R | $224,000 | -- | |
| Son Chumcosol | $142,900 | -- | |
| Brown Marcus E | $237,000 | -- | |
| Luanei Construction Ll | $109,900 | -- | |
| Argent Mortgage Co Llc | -- | -- | |
| Hoff Edward R | $224,000 | -- | |
| Son Chumcosol | $142,900 | -- |
Source: Public Records
Mortgage History
| Date | Status | Borrower | Loan Amount |
|---|---|---|---|
| Open | Son Chumcosol | $227,401 | |
| Closed | Son Chumcosol | $227,401 |
Source: Public Records
Tax History
| Year | Tax Paid | Tax Assessment Tax Assessment Total Assessment is a certain percentage of the fair market value that is determined by local assessors to be the total taxable value of land and additions on the property. | Land | Improvement |
|---|---|---|---|---|
| 2025 | $8,929 | $258,580 | $75,250 | $183,330 |
| 2024 | $7,920 | $163,240 | $52,080 | $111,160 |
| 2023 | $7,592 | $163,240 | $52,080 | $111,160 |
| 2022 | $7,444 | $163,240 | $52,080 | $111,160 |
| 2021 | $7,569 | $163,240 | $52,080 | $111,160 |
| 2020 | $7,457 | $144,060 | $47,880 | $96,180 |
| 2019 | $7,011 | $144,060 | $47,880 | $96,180 |
| 2018 | $6,951 | $144,060 | $47,880 | $96,180 |
| 2017 | $7,499 | $144,060 | $47,880 | $96,180 |
| 2016 | $6,563 | $144,060 | $47,880 | $96,180 |
| 2015 | $6,768 | $167,720 | $51,520 | $116,200 |
| 2014 | $6,726 | $167,720 | $51,520 | $116,200 |
Source: Public Records
Map
Nearby Homes
- 16 Sorensen Rd
- 51 Woody Ln
- 292 Richmond Ave
- 52 Saw Mill Rd
- 166 Saw Mill Rd
- 70 Edward St
- 481 Savin Ave
- 330 Savin Ave Unit 76
- 330 Savin Ave Unit 32
- 44 Church St
- 155 Leete St
- 327 Center St
- 248 William St
- 350 Campbell Ave
- 79 Claudia Dr Unit 354
- 5 W Prospect St
- 12 Linda St
- 206 Highland Ave
- 77 Atwater St
- 68 Eagle Place
Your Personal Tour Guide
Ask me questions while you tour the home.