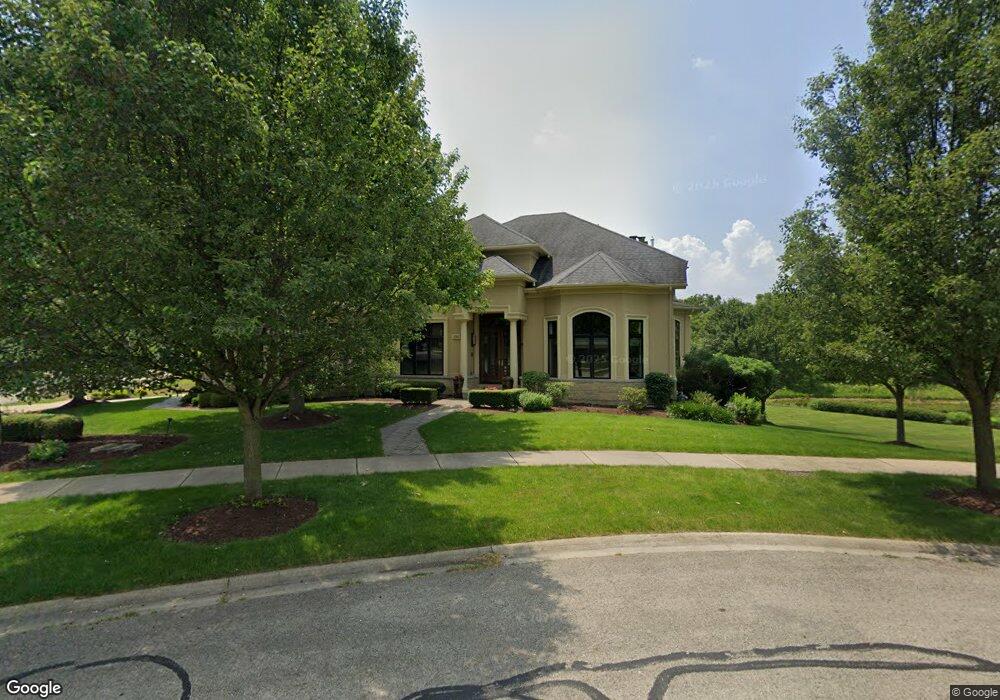
396 Shadow Creek Ln Naperville, IL 60540
Meadow Glens NeighborhoodEstimated Value: $1,968,000 - $2,441,000
Studio
1
Bath
4,721
Sq Ft
$455/Sq Ft
Est. Value
About This Home
This home is located at 396 Shadow Creek Ln, Naperville, IL 60540 and is currently estimated at $2,145,998, approximately $454 per square foot. 396 Shadow Creek Ln is a home located in DuPage County with nearby schools including Highlands Elementary School, Kennedy Junior High School, and Naperville North High School.
Ownership History
Date
Name
Owned For
Owner Type
Purchase Details
Closed on
Sep 11, 2024
Sold by
Jill M Krueger Trust and Krueger Jill M
Bought by
Malaiska Rolandas and Malaiskiene Irma
Current Estimated Value
Purchase Details
Closed on
Oct 26, 2012
Sold by
South Naperville Associated Partners Llc
Bought by
Cdh Delnor Heath System Inc
Purchase Details
Closed on
Aug 8, 2010
Sold by
Krueger Jill M
Bought by
Krueger Jill M and Jill M Krueger Trust
Home Financials for this Owner
Home Financials are based on the most recent Mortgage that was taken out on this home.
Original Mortgage
$1,000,000
Interest Rate
4.25%
Mortgage Type
New Conventional
Purchase Details
Closed on
Jul 29, 2010
Sold by
Crestview Builders Inc
Bought by
Krueger Jill M
Home Financials for this Owner
Home Financials are based on the most recent Mortgage that was taken out on this home.
Original Mortgage
$1,000,000
Interest Rate
4.25%
Mortgage Type
New Conventional
Create a Home Valuation Report for This Property
The Home Valuation Report is an in-depth analysis detailing your home's value as well as a comparison with similar homes in the area
Home Values in the Area
Average Home Value in this Area
Purchase History
| Date | Buyer | Sale Price | Title Company |
|---|---|---|---|
| Malaiska Rolandas | $2,060,000 | First American Title | |
| Cdh Delnor Heath System Inc | -- | None Available | |
| Krueger Jill M | -- | None Available | |
| Krueger Jill M | $1,829,500 | Ctic |
Source: Public Records
Mortgage History
| Date | Status | Borrower | Loan Amount |
|---|---|---|---|
| Previous Owner | Krueger Jill M | $1,000,000 |
Source: Public Records
Tax History
| Year | Tax Paid | Tax Assessment Tax Assessment Total Assessment is a certain percentage of the fair market value that is determined by local assessors to be the total taxable value of land and additions on the property. | Land | Improvement |
|---|---|---|---|---|
| 2024 | $37,603 | $621,821 | $108,639 | $513,182 |
| 2023 | $36,356 | $567,510 | $99,150 | $468,360 |
| 2022 | $33,002 | $515,920 | $90,140 | $425,780 |
| 2021 | $31,833 | $496,410 | $86,730 | $409,680 |
| 2020 | $31,171 | $487,490 | $85,170 | $402,320 |
| 2019 | $30,305 | $466,410 | $81,490 | $384,920 |
| 2018 | $31,456 | $483,770 | $84,520 | $399,250 |
| 2017 | $30,859 | $467,460 | $81,670 | $385,790 |
| 2016 | $30,281 | $450,570 | $78,720 | $371,850 |
| 2015 | $30,153 | $424,300 | $74,130 | $350,170 |
| 2014 | $31,135 | $424,300 | $74,130 | $350,170 |
| 2013 | $30,664 | $425,320 | $74,310 | $351,010 |
Source: Public Records
Map
Nearby Homes
- 8S452 Bell Dr
- 1532 Swallow St
- 77 Bluebird Ln
- 1204 Hobson Oaks Ct Unit 1204
- 1583 Orchard Cir
- 1449 Whitespire Ct Unit 5104
- 923 Tim Tam Cir
- 510 Harlowe Ln Unit 2001C
- 1546 Treeline Ct Unit 405
- 538 Harlowe Ln Unit 1801
- 908 Julian Ct
- 289 Winding Creek Dr
- 124 E Bailey Rd Unit E
- 1678 Cove Ct Unit 5
- 308 Tamarack Ave
- 1751 S Washington St Unit 1
- 616 Driftwood Ct
- 1710 Coach Dr
- 1715 Amelia Ct
- 313 W Gartner Rd
- 396 Shadow Creek Ln
- 403 Shadow Creek Ct
- 408 Shadow Creek Ct
- 1211 Torrey Pines Ct
- 1212 Torrey Pines Ct
- 407 Shadow Creek Ct
- 1215 Torrey Pines Ct
- 412 Shadow Creek Ct
- 411 Shadow Creek Ct
- 1216 Torrey Pines Ct
- 1219 Torrey Pines Ct
- 415 Hobson Rd
- 415 Shadow Creek Ct
- 416 Shadow Creek Ct
- 1223 Torrey Pines Ct
- 25W780 Hobson Rd
- 1220 Torrey Pines Ct
- 420 Shadow Creek Ct
- 419 Shadow Creek Ct
- 420 Deepwood Ct
Your Personal Tour Guide
Ask me questions while you tour the home.