Estimated Value: $301,596 - $365,000
--
Bed
2
Baths
1,659
Sq Ft
$197/Sq Ft
Est. Value
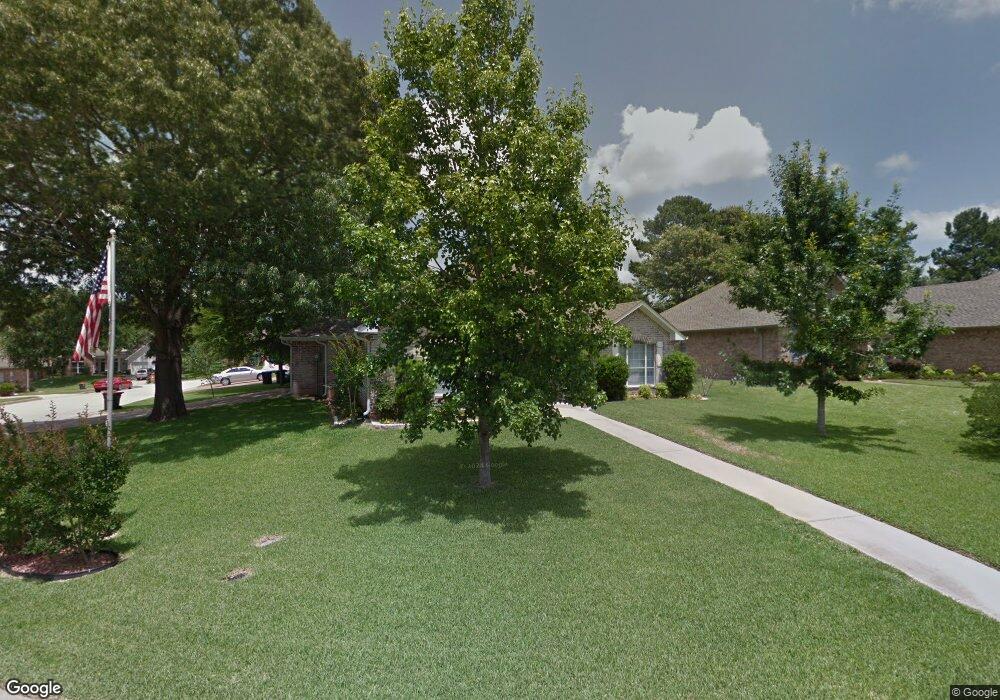
About This Home
This home is located at 3960 3960 Chapel Woods Blvd, Tyler, TX 75707 and is currently estimated at $327,149, approximately $197 per square foot. 3960 3960 Chapel Woods Blvd is a home located in Smith County with nearby schools including Kissam Intermediate School, Jackson Elementary School, and Chapel Hill Middle School.
Ownership History
Date
Name
Owned For
Owner Type
Purchase Details
Closed on
Jan 22, 2021
Sold by
Seeker Berry Lee and Estate Of Jimmy R Seeker
Bought by
Aud Raymond and Aud Sarah
Current Estimated Value
Home Financials for this Owner
Home Financials are based on the most recent Mortgage that was taken out on this home.
Original Mortgage
$205,700
Outstanding Balance
$183,167
Interest Rate
2.71%
Mortgage Type
VA
Estimated Equity
$143,982
Purchase Details
Closed on
Nov 12, 2015
Sold by
Miller Floyd A and Millers Margie S
Bought by
Seeker Jimmy R and Seeker Barbara B
Purchase Details
Closed on
Jul 31, 2013
Sold by
Nixon Margie R
Bought by
Miller Revocable Trust
Purchase Details
Closed on
Apr 8, 2005
Sold by
Chapel Woods Inc
Bought by
Nixon Margie R
Create a Home Valuation Report for This Property
The Home Valuation Report is an in-depth analysis detailing your home's value as well as a comparison with similar homes in the area
Home Values in the Area
Average Home Value in this Area
Purchase History
| Date | Buyer | Sale Price | Title Company |
|---|---|---|---|
| Aud Raymond | -- | None Available | |
| Seeker Jimmy R | -- | None Available | |
| Miller Revocable Trust | -- | None Available | |
| Nixon Margie R | -- | None Available |
Source: Public Records
Mortgage History
| Date | Status | Borrower | Loan Amount |
|---|---|---|---|
| Open | Aud Raymond | $205,700 |
Source: Public Records
Tax History Compared to Growth
Tax History
| Year | Tax Paid | Tax Assessment Tax Assessment Total Assessment is a certain percentage of the fair market value that is determined by local assessors to be the total taxable value of land and additions on the property. | Land | Improvement |
|---|---|---|---|---|
| 2025 | -- | $311,405 | $33,016 | $278,389 |
| 2024 | -- | $278,853 | $38,336 | $281,336 |
| 2023 | $5,583 | $295,642 | $38,336 | $257,306 |
| 2022 | $4,149 | $230,457 | $38,336 | $192,121 |
| 2021 | $3,793 | $200,386 | $38,336 | $162,050 |
| 2020 | $3,909 | $200,386 | $38,336 | $162,050 |
| 2019 | $3,775 | $187,675 | $31,947 | $155,728 |
| 2018 | $3,582 | $179,099 | $31,947 | $147,152 |
| 2017 | $3,500 | $175,011 | $31,947 | $143,064 |
| 2016 | $3,404 | $170,223 | $31,947 | $138,276 |
| 2015 | $714 | $162,090 | $31,947 | $130,143 |
| 2014 | $714 | $159,226 | $31,947 | $127,279 |
Source: Public Records
Map
Nearby Homes
- 4031 Stonebrook Ln
- 4133 Colina Trail
- 3814 Brighton Creek Cir
- 4322 Madera Dr
- 3516 Cabot Ln
- 3889 Brighton Creek Cir
- 4215 Chapel Quarters
- 3515 & 3507 Chapel View
- 4344 Macnab Dr
- 4344 Macnab Dr Unit Multi
- 3858 Broadmoore Ct
- 3515 Chapel View
- 3507 Chapel View
- 4441 Old Omen Rd
- 3647 Bentridge Ct
- 3618 Trailwood Ct
- 3606 Trailwood Ct
- 3617 Flagstone Dr
- 3409 Pebblebrook Dr
- 4008 Pinecreek Dr
- 3960 Chapel Woods Blvd
- 3966 3966 Chapel Woods
- 3966 Chapel Woods Blvd
- 4205 Stonebrook Ln
- 4209 4209 Stonebrook Ln
- 4209 Stonebrook Ln
- 3968 Chapel Woods Blvd
- 3959 Chapel Woods Blvd
- 3955 Chapel Woods Blvd
- 4213 Stonebrook Ln
- 3951 Chapel Woods Blvd
- 3963 Chapel Woods Blvd
- 4129 Stonebrook Ln
- 3967 Chapel Woods Blvd
- 3972 3972 Chapel Woods Blvd
- 3971 3971 Chapel Woods Blvd
- 4219 4219 Stonebrook Ln
- 4219 Stonebrook Ln
- 3971 Chapel Woods Blvd
- 3976 3976 Chapel Woods