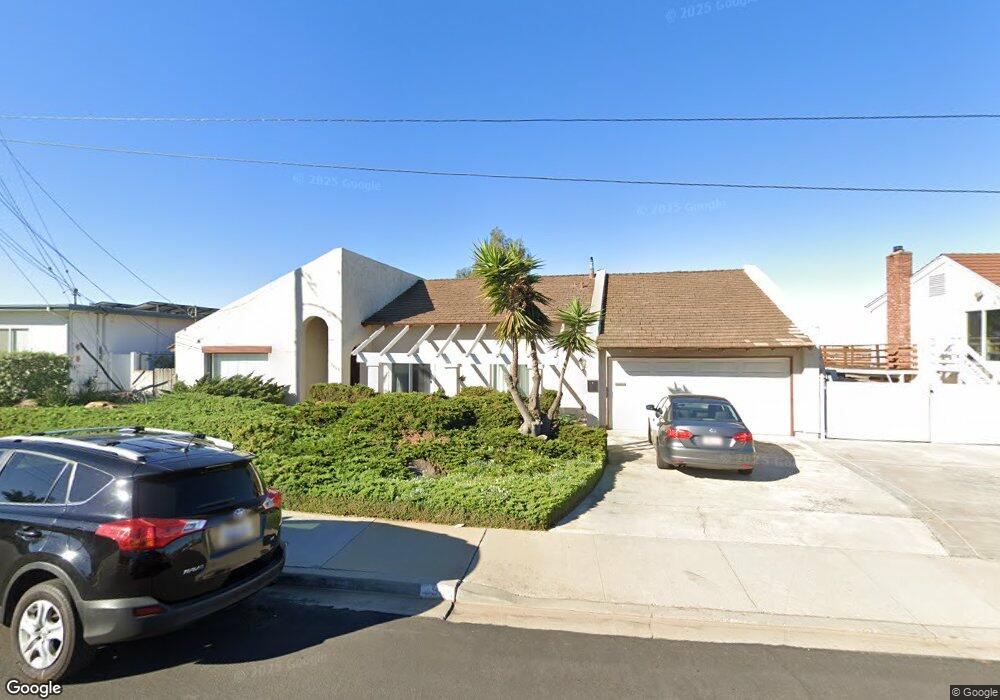
3960 Corolyn Dr La Mesa, CA 91941
Estimated Value: $1,063,590 - $1,280,000
3
Beds
2
Baths
2,256
Sq Ft
$519/Sq Ft
Est. Value
About This Home
This home is located at 3960 Corolyn Dr, La Mesa, CA 91941 and is currently estimated at $1,170,148, approximately $518 per square foot. 3960 Corolyn Dr is a home located in San Diego County with nearby schools including La Mesa Arts Academy, La Mesa Dale Elementary School, and Mount Miguel High School.
Ownership History
Date
Name
Owned For
Owner Type
Purchase Details
Closed on
Feb 8, 2019
Sold by
Osborne Linda M and Herrington Jennifer D
Bought by
Osborne Linda M
Current Estimated Value
Purchase Details
Closed on
Feb 22, 2018
Sold by
Slaughter Steven J
Bought by
Slaughter Steven J and Steven J Slaughter Trust
Purchase Details
Closed on
Apr 10, 2017
Sold by
Slaughter Steven James and Hilton Billie
Bought by
Osborne Linda Marie and Slaughter Steven James
Purchase Details
Closed on
Jun 13, 2014
Sold by
Hilton Billie Jones
Bought by
Slaughter Steven J
Purchase Details
Closed on
Aug 26, 2008
Sold by
Wardley Development Inc
Bought by
Billie J Hilton Trust
Purchase Details
Closed on
Aug 14, 2002
Sold by
Billy Ray Hilton Trust
Bought by
Billy Ray Hilton Trust and Billie Jones Hilton Trust
Create a Home Valuation Report for This Property
The Home Valuation Report is an in-depth analysis detailing your home's value as well as a comparison with similar homes in the area
Purchase History
| Date | Buyer | Sale Price | Title Company |
|---|---|---|---|
| Osborne Linda M | -- | None Available | |
| Slaughter Steven J | -- | None Available | |
| Osborne Linda Marie | -- | None Available | |
| Slaughter Steven J | $299,000 | Ticor Title Company | |
| Hilton Billie Jones | -- | Ticor Title Company | |
| Billie J Hilton Trust | -- | None Available | |
| Billy Ray Hilton Trust | -- | -- |
Source: Public Records
Tax History
| Year | Tax Paid | Tax Assessment Tax Assessment Total Assessment is a certain percentage of the fair market value that is determined by local assessors to be the total taxable value of land and additions on the property. | Land | Improvement |
|---|---|---|---|---|
| 2025 | $5,304 | $382,452 | $180,251 | $202,201 |
| 2024 | $5,304 | $374,954 | $176,717 | $198,237 |
| 2023 | $5,122 | $367,602 | $173,252 | $194,350 |
| 2022 | $5,091 | $360,395 | $169,855 | $190,540 |
| 2021 | $4,981 | $353,329 | $166,525 | $186,804 |
| 2020 | $4,871 | $349,707 | $164,818 | $184,889 |
| 2019 | $4,772 | $342,851 | $161,587 | $181,264 |
| 2018 | $4,806 | $336,129 | $158,419 | $177,710 |
| 2017 | $4,616 | $329,539 | $155,313 | $174,226 |
| 2016 | $4,445 | $323,078 | $152,268 | $170,810 |
| 2015 | $4,389 | $318,226 | $149,981 | $168,245 |
| 2014 | $1,746 | $103,990 | $34,089 | $69,901 |
Source: Public Records
Map
Nearby Homes
- 7945 Shadow Hill Dr
- 7953 Cinthia St
- 7923 Cinthia St
- 4050 Rosarita Dr
- 7948 Cinthia St
- 8022 High St
- 0 Eastridge Dr Unit WS21258579
- 7849 Highwood Ave
- 7790 La Mesa Summit Dr
- 7520 High St Unit 28-30
- 7795 La Mesa Summit Dr
- 7765 La Mesa Summit Dr
- 7760 La Mesa Summit Dr
- 8050-52 Lemon Grove Way
- 3812 Costa Bella Way
- 8146 Lemon Grove Way Unit B
- 8186 Lemon Grove Way Unit E
- 4221 Cobalt Dr
- 4303 Sheldon Dr
- 3635 Grove St Unit 267
- 3970 Corolyn Dr
- 7905 Shadow Hill Dr
- 7920 Shadow Hill Dr
- 3971 Corolyn Dr
- 3980 Corolyn Dr
- 7915 Shadow Hill Dr
- 3981 Corolyn Dr
- 7930 Shadow Hill Dr
- 7929 Eastridge Dr
- 7925 Shadow Hill Dr
- 7939 Eastridge Dr
- 7919 Eastridge Dr
- 7940 Shadow Hill Dr
- 7935 Shadow Hill Dr
- 7920 Eastridge Dr
- 7930 Eastridge Dr
- 7949 Eastridge Dr
- 7916 Eastridge Dr
- 7940 Eastridge Dr
- 7912 Eastridge Dr
Your Personal Tour Guide
Ask me questions while you tour the home.