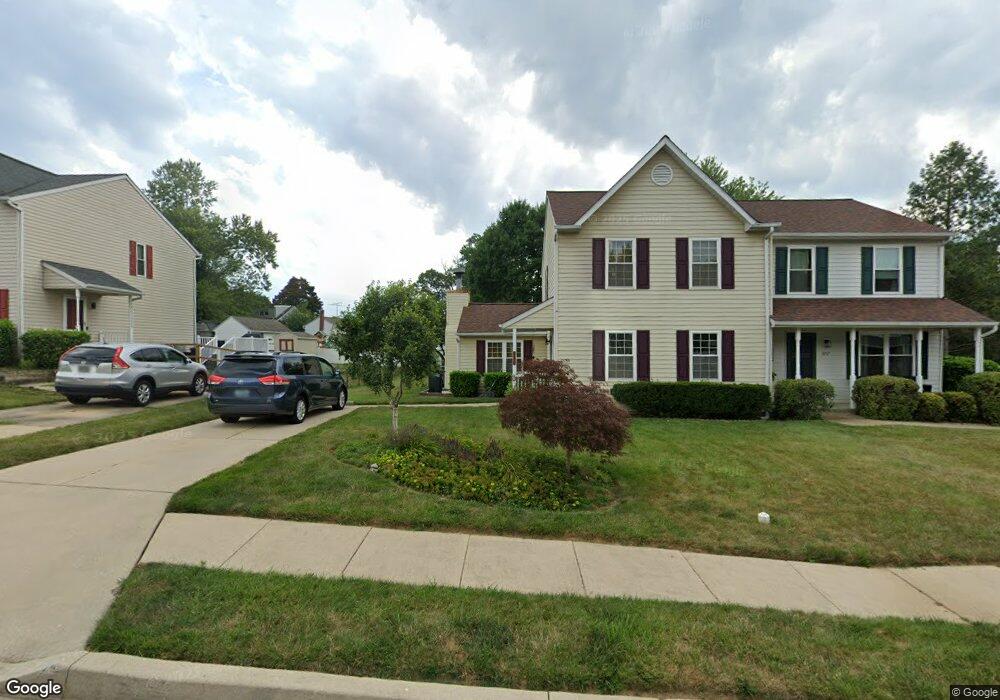
3961 Christopher Way Hampstead, MD 21074
Estimated Value: $277,000 - $418,000
3
Beds
4
Baths
1,392
Sq Ft
$250/Sq Ft
Est. Value
About This Home
This home is located at 3961 Christopher Way, Hampstead, MD 21074 and is currently estimated at $348,059, approximately $250 per square foot. 3961 Christopher Way is a home located in Carroll County with nearby schools including Hampstead Elementary School, Shiloh Middle School, and Manchester Valley High School.
Ownership History
Date
Name
Owned For
Owner Type
Purchase Details
Closed on
Mar 10, 2010
Sold by
Simmons Robyn Michele
Bought by
Hacking Chad D and Hacking Brendalyn R
Current Estimated Value
Purchase Details
Closed on
Nov 24, 2008
Sold by
Simmons Robyn Michele
Bought by
Simmons Robyn Michele
Purchase Details
Closed on
Oct 27, 2008
Sold by
Simmons Robyn Michele
Bought by
Simmons Robyn Michele
Purchase Details
Closed on
Sep 17, 2008
Sold by
Simmons Robyn Michele
Bought by
Simmons Robyn Michele
Purchase Details
Closed on
May 5, 2005
Sold by
Rodgers Viola
Bought by
Simmons Robyn Michele and Simmons Herman Joseph
Purchase Details
Closed on
Jun 1, 2004
Sold by
Smith Daniel Albert
Bought by
Rodgers Viola
Purchase Details
Closed on
Oct 8, 1999
Sold by
Yarchin Bradly
Bought by
Smith Daniel Albert and Smith Marybeth Ann
Purchase Details
Closed on
Jul 2, 1996
Sold by
Fisher Bruce
Bought by
Yarchin Bradly and Yarchin Dawn
Create a Home Valuation Report for This Property
The Home Valuation Report is an in-depth analysis detailing your home's value as well as a comparison with similar homes in the area
Home Values in the Area
Average Home Value in this Area
Purchase History
| Date | Buyer | Sale Price | Title Company |
|---|---|---|---|
| Hacking Chad D | $217,900 | -- | |
| Simmons Robyn Michele | -- | -- | |
| Simmons Robyn Michele | -- | -- | |
| Simmons Robyn Michele | -- | -- | |
| Simmons Robyn Michele | $175,900 | -- | |
| Rodgers Viola | $170,000 | -- | |
| Smith Daniel Albert | $119,900 | -- | |
| Yarchin Bradly | $117,500 | -- |
Source: Public Records
Tax History
| Year | Tax Paid | Tax Assessment Tax Assessment Total Assessment is a certain percentage of the fair market value that is determined by local assessors to be the total taxable value of land and additions on the property. | Land | Improvement |
|---|---|---|---|---|
| 2025 | $3,701 | $283,100 | $90,000 | $193,100 |
| 2024 | $3,515 | $266,167 | $0 | $0 |
| 2023 | $3,335 | $249,233 | $0 | $0 |
| 2022 | $3,163 | $232,300 | $70,000 | $162,300 |
| 2021 | $6,424 | $231,200 | $0 | $0 |
| 2020 | $3,152 | $230,100 | $0 | $0 |
| 2019 | $3,137 | $229,000 | $70,000 | $159,000 |
| 2018 | $3,018 | $221,833 | $0 | $0 |
| 2017 | $2,922 | $214,667 | $0 | $0 |
| 2016 | -- | $207,500 | $0 | $0 |
| 2015 | -- | $201,400 | $0 | $0 |
| 2014 | -- | $195,300 | $0 | $0 |
Source: Public Records
Map
Nearby Homes
- 3815 Sunnyfield Ct Unit 2C
- 0 Hanover Pike Unit MDCR2024542
- 1421 N Main St
- 4131 Shanelle Ct
- 1151 Caton Rd
- 4138 Hillcrest Ave
- 1149 Gypsum Dr
- 1148 Gypsum Dr
- 4210 Upper Beckleysville Rd
- 3830 Normandy Dr Unit 3A
- 3820 Normandy Dr Unit 2A
- 3840 Normandy Dr Unit 2A
- 3992 Terrace Dr
- 3850 Normandy Dr Unit 3A
- 4233 Tumbrell Dr
- 3860 Normandy Dr Unit 3D
- TBD Sommerfield Dr
- TBD Sommerfield Dr Unit (5 ACRES)
- 4211 S Hunter Rd
- 920 N Houcksville Rd
- 3957 Christopher Way
- 3963 Christopher Way
- 3965 Christopher Way
- 3955 Christopher Way
- 1219 N Carroll St
- 1217 N Carroll St
- 1221 N Carroll St
- 3951 Christopher Way
- 3962 Christopher Way
- 3960 Christopher Way
- 1223 N Carroll St
- 3964 Christopher Way
- 1215 N Carroll St
- 3958 Christopher Way
- 3966 Christopher Way
- 3956 Christopher Way
- 1225 N Carroll St
- 3954 Christopher Way
- 3952 Christopher Way
- 1222 N Carroll St
Your Personal Tour Guide
Ask me questions while you tour the home.