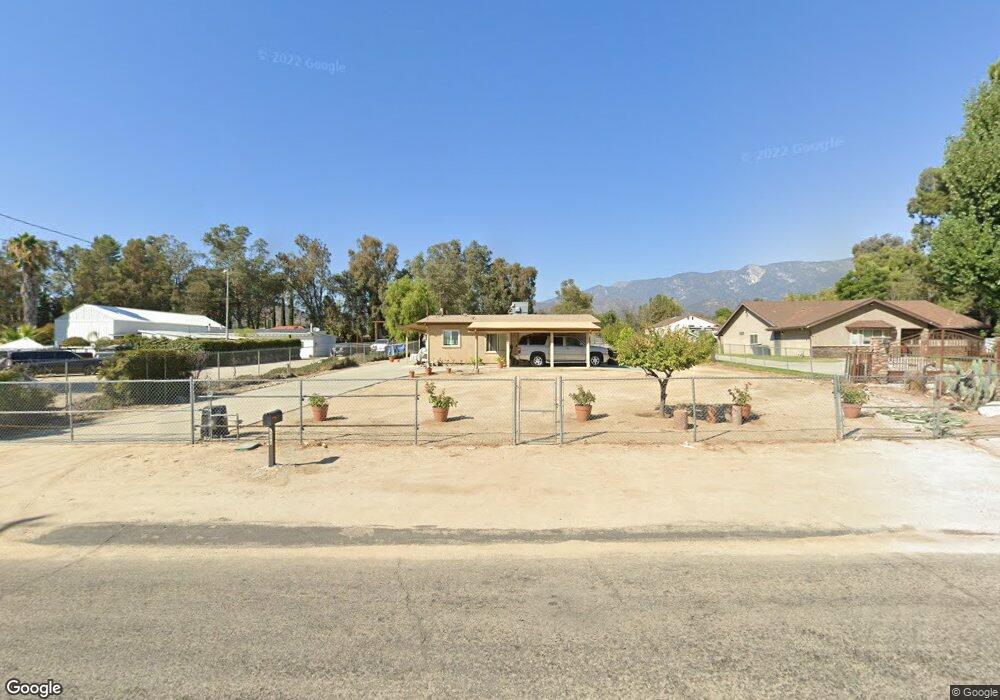
39618 Cherry Valley Blvd Cherry Valley, CA 92223
Estimated Value: $396,000 - $480,000
2
Beds
1
Bath
952
Sq Ft
$453/Sq Ft
Est. Value
About This Home
This home is located at 39618 Cherry Valley Blvd, Cherry Valley, CA 92223 and is currently estimated at $431,516, approximately $453 per square foot. 39618 Cherry Valley Blvd is a home located in Riverside County with nearby schools including Brookside Elementary School, Mountain View Middle School, and Beaumont Senior High School.
Ownership History
Date
Name
Owned For
Owner Type
Purchase Details
Closed on
Aug 25, 2015
Sold by
Martin Joseph W and Martin Maria D
Bought by
The Martin Family Living Trust
Current Estimated Value
Purchase Details
Closed on
Jan 17, 2013
Sold by
Martin Joseph W
Bought by
Martin Joseph W and Martin Maria D
Home Financials for this Owner
Home Financials are based on the most recent Mortgage that was taken out on this home.
Original Mortgage
$37,500
Interest Rate
3.28%
Mortgage Type
New Conventional
Purchase Details
Closed on
Jun 13, 1994
Sold by
Martin Maria Lola
Bought by
Martin Joseph W
Home Financials for this Owner
Home Financials are based on the most recent Mortgage that was taken out on this home.
Original Mortgage
$69,173
Interest Rate
8.6%
Mortgage Type
FHA
Create a Home Valuation Report for This Property
The Home Valuation Report is an in-depth analysis detailing your home's value as well as a comparison with similar homes in the area
Home Values in the Area
Average Home Value in this Area
Purchase History
| Date | Buyer | Sale Price | Title Company |
|---|---|---|---|
| The Martin Family Living Trust | -- | None Available | |
| Martin Joseph W | -- | Old Republic Title Company | |
| Martin Joseph W | -- | Old Republic Title Company | |
| Martin Joseph W | $69,000 | -- |
Source: Public Records
Mortgage History
| Date | Status | Borrower | Loan Amount |
|---|---|---|---|
| Previous Owner | Martin Joseph W | $37,500 | |
| Previous Owner | Martin Joseph W | $69,173 |
Source: Public Records
Tax History
| Year | Tax Paid | Tax Assessment Tax Assessment Total Assessment is a certain percentage of the fair market value that is determined by local assessors to be the total taxable value of land and additions on the property. | Land | Improvement |
|---|---|---|---|---|
| 2025 | $1,465 | $117,234 | $84,962 | $32,272 |
| 2023 | $1,465 | $112,684 | $81,664 | $31,020 |
| 2022 | $1,439 | $110,475 | $80,063 | $30,412 |
| 2021 | $1,411 | $108,310 | $78,494 | $29,816 |
| 2020 | $1,394 | $107,201 | $77,690 | $29,511 |
| 2019 | $1,370 | $105,100 | $76,167 | $28,933 |
| 2018 | $1,362 | $103,040 | $74,673 | $28,367 |
| 2017 | $1,339 | $101,020 | $73,209 | $27,811 |
| 2016 | $1,302 | $99,040 | $71,774 | $27,266 |
| 2015 | $1,279 | $97,554 | $70,697 | $26,857 |
| 2014 | $1,277 | $95,645 | $69,313 | $26,332 |
Source: Public Records
Map
Nearby Homes
- 39657 Baldi Ct
- 10007 Beaumont Ave
- 39068 Vineland St
- 38992 Vineland St
- 11047 Karen Dr
- 10982 Cherry Ave
- 39441 Tokay St
- 0 Tokay St Unit EV22011453
- 1322 Melstone St
- 10885 Jonathan Ave
- 757 Cherry Valley
- 9643 Avenida Miravilla
- 9575 Oak Glen Rd
- 1362 Burham Ct
- 1657 Stone Creek Rd
- 11345 Sunnyslope Ave
- 11285 Cherry Ave
- 9710 Mountain View Ave
- 1335 Alpine Ave
- 40471 Rome Beauty Way
- 39628 Cherry Valley Blvd
- 39620 Cherry Valley Blvd
- 39623 Cherry Valley Blvd
- 39634 Cherry Valley Blvd
- 39556 Cherry Valley Blvd
- 39587 Cherry Valley Blvd
- 39678 Cherry Valley Blvd
- 39567 Cherry Valley Blvd
- 39641 Baldi Ct
- 10440 Live Oak Ave
- 39673 Baldi Ct
- 0 Baldi Ct
- 39700 Cherry Valley Blvd
- 10410 Live Oak Ave
- 39642 Baldi Ct
- 10420 Live Oak Ave
- 39691 Baldi Ct
- 39712 Cherry Valley Blvd
- 39559 Cherry Valley Blvd
- 39658 Baldi Ct
Your Personal Tour Guide
Ask me questions while you tour the home.