Estimated Value: $234,067 - $261,000
About This Home
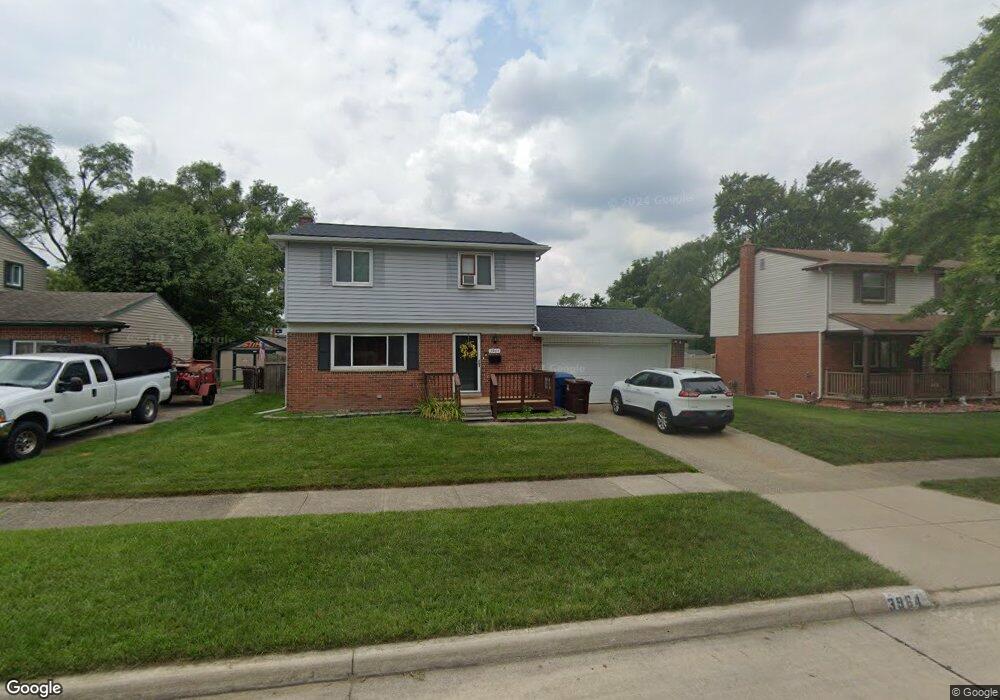
This home is located at 3964 Niagara St Unit Bldg-Unit, Wayne, MI 48184 and is currently estimated at $242,767, approximately $156 per square foot. 3964 Niagara St Unit Bldg-Unit is a home located in Wayne County with nearby schools including Taft-Galloway Elementary School, Benjamin Franklin Middle School, and Wayne Memorial High School.
Ownership History
Purchase Details
Home Financials for this Owner
Home Financials are based on the most recent Mortgage that was taken out on this home.Purchase Details
Home Financials for this Owner
Home Financials are based on the most recent Mortgage that was taken out on this home.Purchase Details
Purchase Details
Purchase Details
Home Values in the Area
Average Home Value in this Area
Purchase History
We collect this data history from publicly available records. To have your information removed, we recommend requesting removal directly through your county’s website.
| Date | Buyer | Sale Price | Title Company |
|---|---|---|---|
| Williams Krystal | $242,000 | Vanguard Title | |
| Kolehmainen Matthew | $145,000 | Visionary Title Agency Llc | |
| Southwest Housing Solutions Corporation | $49,997 | None Available | |
| Federal National Mortgage Association | $56,200 | None Available | |
| Smith Uteka | $151,900 | First American Title Ins Co |
Mortgage History
We collect this data history from publicly available records. To have your information removed, we recommend requesting removal directly through your county’s website.
| Date | Status | Borrower | Loan Amount |
|---|---|---|---|
| Open | Williams Krystal | $237,616 | |
| Previous Owner | Kolehmainen Matthew | $140,650 |
Tax History
| Year | Tax Paid | Tax Assessment Tax Assessment Total Assessment is a certain percentage of the fair market value that is determined by local assessors to be the total taxable value of land and additions on the property. | Land | Improvement |
|---|---|---|---|---|
| 2025 | $3,915 | $91,000 | $0 | $0 |
| 2024 | $2,736 | $85,500 | $0 | $0 |
| 2023 | $2,612 | $70,300 | $0 | $0 |
| 2022 | $2,976 | $62,400 | $0 | $0 |
| 2021 | $2,898 | $59,000 | $0 | $0 |
| 2020 | $3,552 | $53,800 | $0 | $0 |
| 2019 | $2,360 | $50,300 | $0 | $0 |
| 2018 | $2,837 | $44,700 | $0 | $0 |
| 2017 | $685 | $44,000 | $0 | $0 |
| 2016 | $2,164 | $41,600 | $0 | $0 |
| 2015 | $3,780 | $40,200 | $0 | $0 |
| 2013 | $4,020 | $41,100 | $0 | $0 |
| 2012 | -- | $44,400 | $9,600 | $34,800 |
Map
- 4048 Niagara St
- 31682 Carlisle Pkwy
- 31611 Grant St
- 3445 Mildred St
- 3582 Swanson St
- 4616 Hayes St
- 3900 Venoy Rd
- 32572 Woodbrook Dr
- 5157 Niagara St
- 5156 Winifred St
- 5004 Hayes St
- 31546 Alpena Ct
- 33629 Forest St
- 32260 Oscoda Ct
- 31804 Shiawassee St
- 32526 Gateway Dr Unit BLDG2
- 31905 Saginaw Ct
- 4532 Howe Rd
- 32516 Newaygo St
- 32565 Mason St
- 3928 Niagara St
- 3944 Niagara St
- 3916 Niagara St
- 3941 Winifred St
- 3953 Winifred St
- 3929 Winifred St
- 3965 Winifred St
- 3980 Niagara St
- 3917 Winifred St
- 3977 Winifred St
- 3876 Niagara St
- 3941 Niagara St
- 3929 Niagara St
- 4000 Niagara St
- 3989 Winifred St
- 3965 Niagara St
- 3917 Niagara St
- 3977 Niagara St
- 3877 Winifred St
- 3864 Niagara St
Ask me questions while you tour the home.