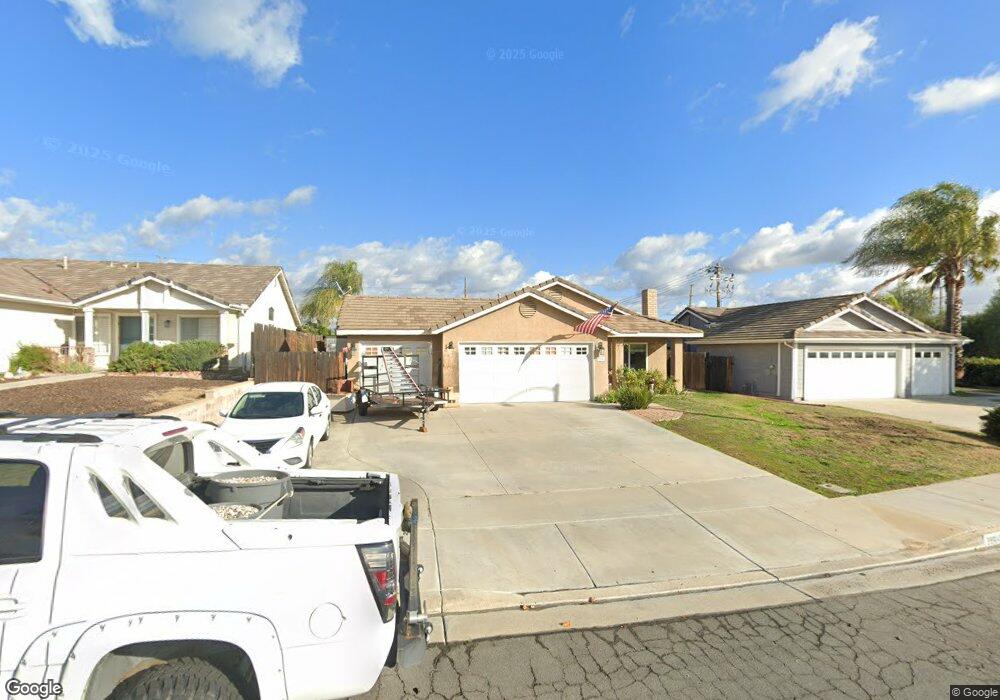
39640 Diego Dr Temecula, CA 92591
Roripaugh Ranch NeighborhoodEstimated Value: $626,000 - $646,000
3
Beds
2
Baths
1,512
Sq Ft
$418/Sq Ft
Est. Value
About This Home
This home is located at 39640 Diego Dr, Temecula, CA 92591 and is currently estimated at $631,804, approximately $417 per square foot. 39640 Diego Dr is a home located in Riverside County with nearby schools including Nicolas Valley Elementary School, James L. Day Middle School, and Chaparral High School.
Ownership History
Date
Name
Owned For
Owner Type
Purchase Details
Closed on
Mar 19, 1998
Sold by
Hud
Bought by
Jennings John R and Jennings Faye T
Current Estimated Value
Home Financials for this Owner
Home Financials are based on the most recent Mortgage that was taken out on this home.
Original Mortgage
$123,978
Outstanding Balance
$22,761
Interest Rate
7.06%
Mortgage Type
FHA
Estimated Equity
$609,043
Purchase Details
Closed on
Oct 9, 1997
Sold by
Norwest Mtg Inc Nc
Bought by
Hud
Purchase Details
Closed on
Sep 21, 1993
Sold by
Barclay Estates
Bought by
Shoemaker Mary
Home Financials for this Owner
Home Financials are based on the most recent Mortgage that was taken out on this home.
Original Mortgage
$146,547
Interest Rate
6.98%
Mortgage Type
FHA
Purchase Details
Closed on
Jul 22, 1993
Sold by
Jld Properties
Bought by
Barclay Estates
Create a Home Valuation Report for This Property
The Home Valuation Report is an in-depth analysis detailing your home's value as well as a comparison with similar homes in the area
Home Values in the Area
Average Home Value in this Area
Purchase History
| Date | Buyer | Sale Price | Title Company |
|---|---|---|---|
| Jennings John R | $125,000 | Gateway Title Company | |
| Hud | -- | Fidelity National Title Ins | |
| Norwest Mtg Inc | $170,690 | Fidelity National Title Ins | |
| Shoemaker Mary | $149,000 | Continental Lawyers Title | |
| Barclay Estates | -- | Continental Lawyers Title |
Source: Public Records
Mortgage History
| Date | Status | Borrower | Loan Amount |
|---|---|---|---|
| Open | Jennings John R | $123,978 | |
| Previous Owner | Shoemaker Mary | $146,547 |
Source: Public Records
Tax History
| Year | Tax Paid | Tax Assessment Tax Assessment Total Assessment is a certain percentage of the fair market value that is determined by local assessors to be the total taxable value of land and additions on the property. | Land | Improvement |
|---|---|---|---|---|
| 2025 | $3,044 | $233,963 | $55,866 | $178,097 |
| 2023 | $3,044 | $224,880 | $53,698 | $171,182 |
| 2022 | $2,951 | $220,472 | $52,646 | $167,826 |
| 2021 | $2,887 | $216,150 | $51,614 | $164,536 |
| 2020 | $2,855 | $213,934 | $51,085 | $162,849 |
| 2019 | $2,816 | $209,740 | $50,084 | $159,656 |
| 2018 | $2,761 | $205,628 | $49,102 | $156,526 |
| 2017 | $2,714 | $201,597 | $48,140 | $153,457 |
| 2016 | $2,668 | $197,646 | $47,197 | $150,449 |
| 2015 | $2,620 | $194,679 | $46,489 | $148,190 |
| 2014 | $2,543 | $190,867 | $45,579 | $145,288 |
Source: Public Records
Map
Nearby Homes
- 39823 Payton Ct
- 39883 S Creek Cir
- 30925 Nicolas Rd
- 39171 Mountain Sky Cir
- 30558 Kentfield Dr
- 39774 Amberley Cir
- 39060 Lonesome Spur Cir
- 30631 Mulberry Ct
- 31291 Tommy Ln
- 39198 Calistoga Dr
- 30354 Falcon Point Ct
- 30545 Mulberry Ct
- 31134 Maverick Ln
- 39480 Almaden Cir
- 31280 Whistling Acres Dr
- 39269 Salinas Dr
- 31171 Old Trail Cir
- 30966 Riverton Ln
- 39116 Clear Creek Ln
- 31371 Magnolia Point
- 39654 Diego Dr
- 39626 Diego Dr
- 39612 Diego Dr
- 30910 Jons Place
- 39600 Diego Dr
- 39621 Diego Dr
- 30894 Jons Place
- 39607 Diego Dr
- 39588 Diego Dr
- 39597 Diego Dr
- 30880 Jons Place
- 39576 Diego Dr
- 39583 Diego Dr
- 39618 Seraphina Rd
- 39604 Seraphina Rd
- 30868 Jons Place
- 39596 Seraphina Rd
- 39571 Diego Dr
- 39584 Seraphina Rd
- 39552 Diego Dr
Your Personal Tour Guide
Ask me questions while you tour the home.