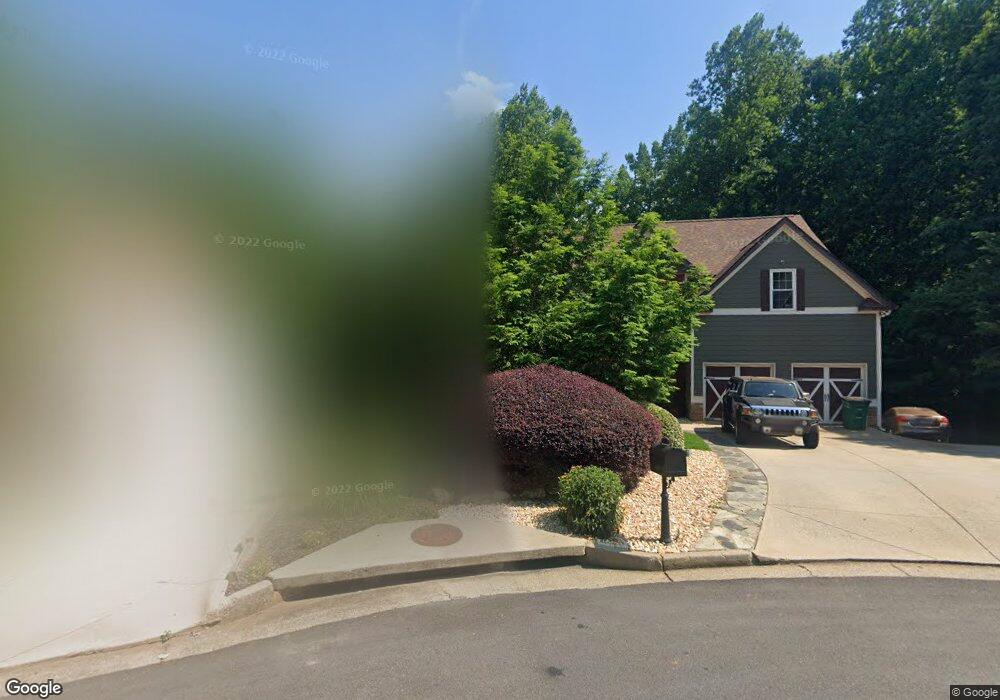
3966 Walnut Grove Way Unit 99 Gainesville, GA 30506
Estimated Value: $406,000 - $458,049
5
Beds
3
Baths
2,891
Sq Ft
$150/Sq Ft
Est. Value
About This Home
This home is located at 3966 Walnut Grove Way Unit 99, Gainesville, GA 30506 and is currently estimated at $433,762, approximately $150 per square foot. 3966 Walnut Grove Way Unit 99 is a home located in Hall County with nearby schools including Lanier Elementary School, Chestatee Middle School, and Chestatee High School.
Ownership History
Date
Name
Owned For
Owner Type
Purchase Details
Closed on
Nov 22, 2005
Sold by
Hirneisen Holly M
Bought by
Hirneisen Holly M and Hirneisen David J
Current Estimated Value
Home Financials for this Owner
Home Financials are based on the most recent Mortgage that was taken out on this home.
Original Mortgage
$173,440
Outstanding Balance
$93,896
Interest Rate
6.04%
Mortgage Type
New Conventional
Estimated Equity
$339,866
Purchase Details
Closed on
Nov 10, 2005
Sold by
Ccm Homes Llc
Bought by
Hirneisen Holly M
Home Financials for this Owner
Home Financials are based on the most recent Mortgage that was taken out on this home.
Original Mortgage
$173,440
Outstanding Balance
$93,896
Interest Rate
6.04%
Mortgage Type
New Conventional
Estimated Equity
$339,866
Purchase Details
Closed on
Feb 11, 2005
Sold by
Pinebrook Development Llc
Bought by
Ccm Homes Llc
Home Financials for this Owner
Home Financials are based on the most recent Mortgage that was taken out on this home.
Original Mortgage
$312,740
Interest Rate
5.61%
Create a Home Valuation Report for This Property
The Home Valuation Report is an in-depth analysis detailing your home's value as well as a comparison with similar homes in the area
Home Values in the Area
Average Home Value in this Area
Purchase History
| Date | Buyer | Sale Price | Title Company |
|---|---|---|---|
| Hirneisen Holly M | -- | -- | |
| Hirneisen Holly M | $216,900 | -- | |
| Ccm Homes Llc | $70,000 | -- |
Source: Public Records
Mortgage History
| Date | Status | Borrower | Loan Amount |
|---|---|---|---|
| Open | Hirneisen Holly M | $173,440 | |
| Previous Owner | Ccm Homes Llc | $312,740 |
Source: Public Records
Tax History Compared to Growth
Tax History
| Year | Tax Paid | Tax Assessment Tax Assessment Total Assessment is a certain percentage of the fair market value that is determined by local assessors to be the total taxable value of land and additions on the property. | Land | Improvement |
|---|---|---|---|---|
| 2025 | $4,467 | $193,080 | $37,760 | $155,320 |
| 2024 | $4,595 | $182,920 | $34,720 | $148,200 |
| 2023 | $4,843 | $185,040 | $36,360 | $148,680 |
| 2022 | $3,312 | $125,640 | $11,560 | $114,080 |
| 2021 | $3,153 | $117,280 | $11,560 | $105,720 |
| 2020 | $3,140 | $113,480 | $10,880 | $102,600 |
| 2019 | $3,165 | $113,440 | $6,680 | $106,760 |
| 2018 | $3,135 | $108,760 | $6,560 | $102,200 |
| 2017 | $2,741 | $96,440 | $6,560 | $89,880 |
| 2016 | $2,463 | $89,920 | $4,040 | $85,880 |
| 2015 | $1,925 | $85,560 | $4,040 | $81,520 |
| 2014 | $1,925 | $69,560 | $4,040 | $65,520 |
Source: Public Records
Map
Nearby Homes
- 3740 Woodlane Rd
- 3903 Walnut Grove Way
- 4032 Deerlope Ct Unit 9999
- 3916 Petes Dr
- 3804 Price Rd
- 3834 Covered Bridge Place
- 3831 Brookburn Park
- 3938 Pointe N
- 3649 Garden Blvd
- 4107 Belvedere Dr
- 3675 Rosedale Cir
- 4114 Belvedere Dr
- 3681 Ledan Rd
- 3557 Meadow Ln
- 3746 Ledan Rd
- 4076 Fairmont St
- 3772 Ledan Rd
- 4118 Riverbrook Terrace
- 3712 Corinth Dr
- 4132 Riverbrook Terrace
- 3970 Walnut Grove Way
- 3970 Walnut Grove Way Unit 99
- 3962 Walnut Grove Way
- 4185 Deer Springs Way
- 4185 Deer Springs Way Unit 99
- 4181 Deer Springs Way
- 4181 Deer Springs Way Unit 99
- 3965 Walnut Grove Way Unit 99
- 3961 Walnut Grove Way
- 3954 Walnut Grove Way
- 4177 Deer Springs Way
- 4177 Deer Springs Way Unit 99
- 4189 Deer Springs Way
- 3953 Walnut Grove Way
- 3953 Walnut Grove Way Unit 102 BL A
- 3953 Walnut Grove Way Unit 99
- 3946 Walnut Grove Way
- 3898 Blue Sky Ct Unit 9999
- 4173 Deer Springs Way
- 4173 Deer Springs Way Unit 99