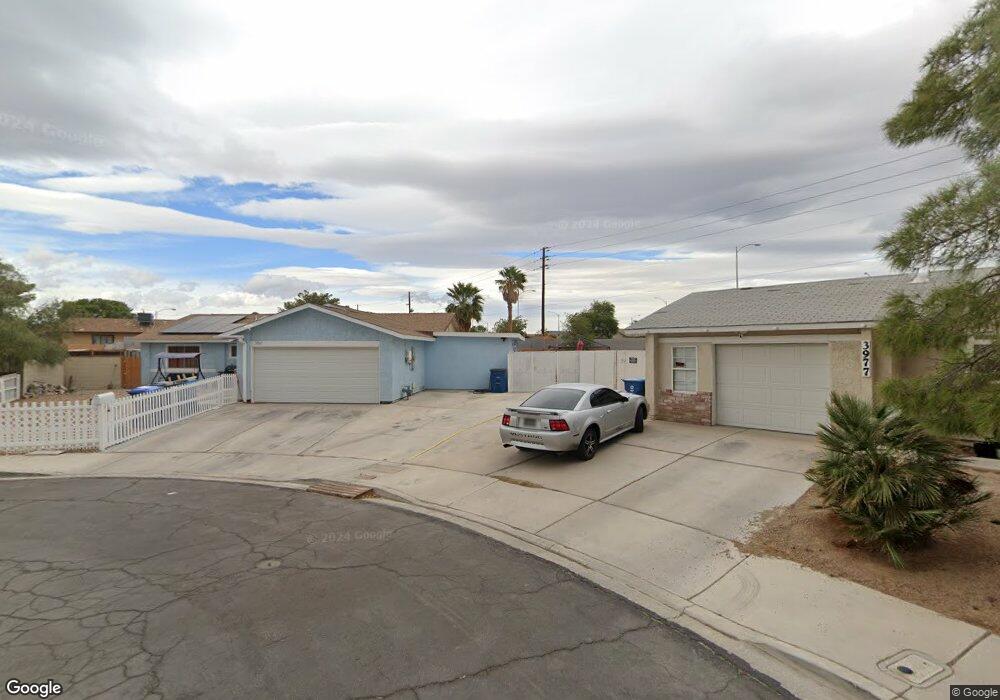
3967 Longfellow St Unit 4 Las Vegas, NV 89115
Estimated Value: $343,000 - $402,000
3
Beds
2
Baths
1,628
Sq Ft
$231/Sq Ft
Est. Value
About This Home
This home is located at 3967 Longfellow St Unit 4, Las Vegas, NV 89115 and is currently estimated at $376,148, approximately $231 per square foot. 3967 Longfellow St Unit 4 is a home located in Clark County with nearby schools including Gwendolyn Woolley Elementary School, Clyde C. Cox Elementary School, and Marvin M Sedway Middle School.
Ownership History
Date
Name
Owned For
Owner Type
Purchase Details
Closed on
Sep 25, 2021
Sold by
Pla Ortiz Luis and Pla Luis
Bought by
Pla Ortiz Luis and Escobar Lagos Nubia
Current Estimated Value
Home Financials for this Owner
Home Financials are based on the most recent Mortgage that was taken out on this home.
Original Mortgage
$152,625
Outstanding Balance
$139,180
Interest Rate
2.8%
Mortgage Type
FHA
Estimated Equity
$236,968
Purchase Details
Closed on
Nov 15, 2011
Sold by
Montesa Llc
Bought by
Pla Luis
Home Financials for this Owner
Home Financials are based on the most recent Mortgage that was taken out on this home.
Original Mortgage
$77,972
Interest Rate
4.25%
Mortgage Type
FHA
Purchase Details
Closed on
Jun 28, 2011
Sold by
Gibson Bruce E and Gibson Glenda G
Bought by
Montesa Llc
Create a Home Valuation Report for This Property
The Home Valuation Report is an in-depth analysis detailing your home's value as well as a comparison with similar homes in the area
Home Values in the Area
Average Home Value in this Area
Purchase History
| Date | Buyer | Sale Price | Title Company |
|---|---|---|---|
| Pla Ortiz Luis | -- | Stewart Title Company Fo | |
| Pla Luis | $80,000 | National Title Company | |
| Montesa Llc | $44,000 | National Title Company |
Source: Public Records
Mortgage History
| Date | Status | Borrower | Loan Amount |
|---|---|---|---|
| Open | Pla Ortiz Luis | $152,625 | |
| Closed | Pla Luis | $77,972 |
Source: Public Records
Tax History Compared to Growth
Tax History
| Year | Tax Paid | Tax Assessment Tax Assessment Total Assessment is a certain percentage of the fair market value that is determined by local assessors to be the total taxable value of land and additions on the property. | Land | Improvement |
|---|---|---|---|---|
| 2025 | $848 | $67,919 | $30,415 | $37,504 |
| 2024 | $785 | $67,919 | $30,415 | $37,504 |
| 2023 | $785 | $65,712 | $29,260 | $36,452 |
| 2022 | $728 | $58,640 | $25,025 | $33,615 |
| 2021 | $674 | $55,379 | $23,100 | $32,279 |
| 2020 | $623 | $52,754 | $20,405 | $32,349 |
| 2019 | $584 | $48,740 | $16,555 | $32,185 |
| 2018 | $557 | $45,475 | $14,350 | $31,125 |
| 2017 | $1,290 | $43,978 | $12,250 | $31,728 |
| 2016 | $775 | $40,190 | $7,700 | $32,490 |
| 2015 | $521 | $25,925 | $4,900 | $21,025 |
| 2014 | $757 | $21,467 | $4,900 | $16,567 |
Source: Public Records
Map
Nearby Homes
- 3954 N Walnut Rd
- 3993 Gulliver St
- 3829 Northern Light Dr
- 4024 Edwin Place
- 3711 Southern Light Dr
- 3747 Gulliver St
- 4102 Wendy Ln
- 4199 Dobson Dr
- 4211 Dobson Dr
- 4064 Rocky Beach Dr
- 3883 Lancome St
- 3796 Steinbeck Dr
- 3837 Kellogg Ave
- 4202 Mango Tree Ct
- 3870 E Gowan Rd
- 4311 Faberge Ave
- 3915 Eblick Wash Dr
- 3736 Steinbeck Dr
- 4349 Faberge Ave
- 6209 Gambetta St
- 3977 Longfellow St
- 3957 Longfellow St
- 3998 Savoy Ct
- 3990 Savoy Ct
- 3947 Longfellow St
- 3978 Longfellow St
- 3991 Savoy Ct
- 3968 Longfellow St
- 3972 Savoy Ct
- 4011 Fernleaf Dr
- 3958 Longfellow St
- 3973 Savoy Ct
- 4008 Timberlodge Ln
- 3965 White Horse St
- 4002 Timberlodge Ln
- 3991 Shady Oak Dr
- 3971 Twylah St
- 4021 Fernleaf Dr
- 3956 Seedling Way
- 3954 Savoy Ct