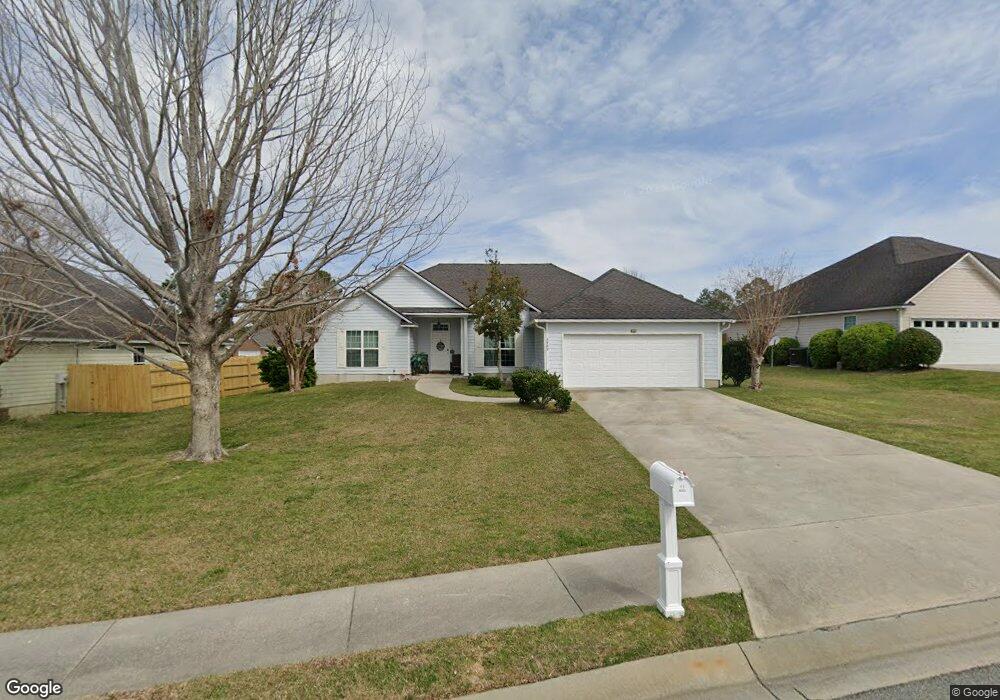
3969 Applecross Rd Valdosta, GA 31605
Estimated Value: $256,721 - $299,000
3
Beds
2
Baths
1,725
Sq Ft
$159/Sq Ft
Est. Value
About This Home
This home is located at 3969 Applecross Rd, Valdosta, GA 31605 and is currently estimated at $274,430, approximately $159 per square foot. 3969 Applecross Rd is a home located in Lowndes County with nearby schools including Sallas Mahone Elementary School, Valdosta Middle School, and Valdosta High School.
Ownership History
Date
Name
Owned For
Owner Type
Purchase Details
Closed on
Aug 27, 2021
Sold by
Thomas Jonathan L
Bought by
Thomas Jonathan L and Thomas Kimiko I
Current Estimated Value
Home Financials for this Owner
Home Financials are based on the most recent Mortgage that was taken out on this home.
Original Mortgage
$231,198
Outstanding Balance
$210,373
Interest Rate
2.8%
Mortgage Type
VA
Estimated Equity
$64,057
Purchase Details
Closed on
Oct 6, 2005
Sold by
Prentice Taylor Construction
Bought by
Webber Stephen L
Home Financials for this Owner
Home Financials are based on the most recent Mortgage that was taken out on this home.
Original Mortgage
$174,165
Interest Rate
5.66%
Mortgage Type
VA
Purchase Details
Closed on
Mar 5, 2004
Sold by
Ampride Highlands Llc
Bought by
Taylor Prentice Construction Inc
Create a Home Valuation Report for This Property
The Home Valuation Report is an in-depth analysis detailing your home's value as well as a comparison with similar homes in the area
Home Values in the Area
Average Home Value in this Area
Purchase History
| Date | Buyer | Sale Price | Title Company |
|---|---|---|---|
| Thomas Jonathan L | -- | -- | |
| Thomas Jonathan L | $226,000 | -- | |
| Webber Stephen L | $170,500 | -- | |
| Taylor Prentice Construction Inc | $29,500 | -- |
Source: Public Records
Mortgage History
| Date | Status | Borrower | Loan Amount |
|---|---|---|---|
| Open | Thomas Jonathan L | $231,198 | |
| Previous Owner | Webber Stephen L | $174,165 |
Source: Public Records
Tax History Compared to Growth
Tax History
| Year | Tax Paid | Tax Assessment Tax Assessment Total Assessment is a certain percentage of the fair market value that is determined by local assessors to be the total taxable value of land and additions on the property. | Land | Improvement |
|---|---|---|---|---|
| 2024 | -- | $95,444 | $14,000 | $81,444 |
| 2023 | $3,225 | $95,444 | $14,000 | $81,444 |
| 2022 | $2,862 | $84,686 | $14,000 | $70,686 |
| 2021 | $2,253 | $64,789 | $14,000 | $50,789 |
| 2020 | $2,301 | $64,789 | $14,000 | $50,789 |
| 2019 | $2,300 | $64,789 | $14,000 | $50,789 |
| 2018 | $2,330 | $64,789 | $14,000 | $50,789 |
| 2017 | $2,346 | $64,789 | $14,000 | $50,789 |
| 2016 | $2,399 | $66,360 | $14,000 | $52,360 |
| 2015 | $2,202 | $66,360 | $14,000 | $52,360 |
| 2014 | $2,239 | $66,360 | $14,000 | $52,360 |
Source: Public Records
Map
Nearby Homes
- 4139 Whithorn Way
- 5239 Fortress Cir
- 3815 Edinburg Cir
- 5327 Vine Dr
- 5073 Branch Point Dr
- 4049 Applecross Rd
- 4230 Whithorn Way
- 3476 Greenhill Dr
- 5349 Branch Point Dr
- The Belfort Plan at Hawthorne North
- The Beau Plan at Hawthorne North
- The Ryleigh Plan at Hawthorne North
- The Carol Plan at Hawthorne North
- The Walker Plan at Hawthorne North
- 1.39 ac. Bemiss Rd
- 4475 Bemiss Rd
- 3105 Wallace Dr
- 4300 Bemiss Rd
- 3618 Hearthstone Dr
- 3762 Knights Mill Dr
- 3973 Applecross Rd
- 3965 Applecross Rd
- 4306 Aberdeen Dr
- 3977 Applecross Rd
- 3970 Applecross Rd
- 4305 Stonehaven Dr
- 3974 Applecross Rd
- 4310 Aberdeen Dr
- 3964 Applecross Rd
- 3957 Applecross Rd
- 3978 Applecross Rd
- 4088 Huntley Dr
- 4309 Stonehaven Dr
- 4314 Aberdeen Dr
- 5183 Branch Point Dr
- 5179 Branch Point Dr
- 4089 Huntley Dr
- 3981 Applecross Rd
- 3960 Applecross Rd
- 5191 Branch Point Dr