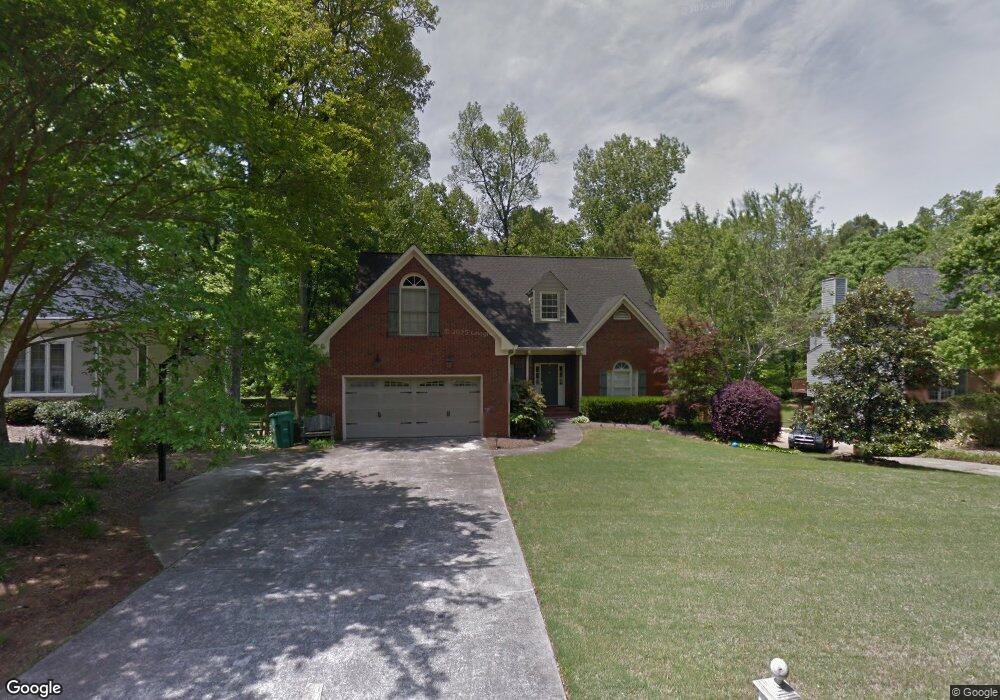
3969 Devon Oaks Dr NE Unit 40 Marietta, GA 30066
Sandy Plains NeighborhoodEstimated Value: $711,000 - $833,000
4
Beds
3
Baths
4,009
Sq Ft
$188/Sq Ft
Est. Value
About This Home
This home is located at 3969 Devon Oaks Dr NE Unit 40, Marietta, GA 30066 and is currently estimated at $753,263, approximately $187 per square foot. 3969 Devon Oaks Dr NE Unit 40 is a home located in Cobb County with nearby schools including Rocky Mount Elementary School, Simpson Middle School, and Lassiter High School.
Ownership History
Date
Name
Owned For
Owner Type
Purchase Details
Closed on
Jan 17, 2019
Sold by
Besses Valerie M
Bought by
Barba Kristen Robinson and Barba David Matthew
Current Estimated Value
Home Financials for this Owner
Home Financials are based on the most recent Mortgage that was taken out on this home.
Original Mortgage
$303,298
Outstanding Balance
$266,128
Interest Rate
4.6%
Mortgage Type
New Conventional
Estimated Equity
$487,135
Purchase Details
Closed on
Sep 2, 2015
Sold by
Besses Louis
Bought by
Besses Valerie
Purchase Details
Closed on
Aug 16, 2011
Sold by
Trimble Ann Baughman
Bought by
Besses Louis L and Besses Valerie M
Home Financials for this Owner
Home Financials are based on the most recent Mortgage that was taken out on this home.
Original Mortgage
$316,761
Interest Rate
4.37%
Mortgage Type
FHA
Create a Home Valuation Report for This Property
The Home Valuation Report is an in-depth analysis detailing your home's value as well as a comparison with similar homes in the area
Home Values in the Area
Average Home Value in this Area
Purchase History
| Date | Buyer | Sale Price | Title Company |
|---|---|---|---|
| Barba Kristen Robinson | $356,000 | -- | |
| Besses Valerie | -- | -- | |
| Besses Louis L | $325,000 | -- |
Source: Public Records
Mortgage History
| Date | Status | Borrower | Loan Amount |
|---|---|---|---|
| Open | Barba Kristen Robinson | $303,298 | |
| Previous Owner | Besses Louis L | $316,761 |
Source: Public Records
Tax History Compared to Growth
Tax History
| Year | Tax Paid | Tax Assessment Tax Assessment Total Assessment is a certain percentage of the fair market value that is determined by local assessors to be the total taxable value of land and additions on the property. | Land | Improvement |
|---|---|---|---|---|
| 2025 | $7,121 | $270,724 | $60,000 | $210,724 |
| 2024 | $7,126 | $270,724 | $60,000 | $210,724 |
| 2023 | $5,290 | $211,072 | $40,000 | $171,072 |
| 2022 | $5,647 | $200,752 | $28,000 | $172,752 |
| 2021 | $4,048 | $142,400 | $22,080 | $120,320 |
| 2020 | $4,048 | $142,400 | $22,080 | $120,320 |
| 2019 | $5,474 | $180,356 | $28,000 | $152,356 |
| 2018 | $5,474 | $180,356 | $28,000 | $152,356 |
| 2017 | $4,642 | $161,452 | $26,000 | $135,452 |
| 2016 | $4,021 | $139,868 | $28,000 | $111,868 |
| 2015 | $4,121 | $139,868 | $28,000 | $111,868 |
| 2014 | $3,628 | $122,128 | $0 | $0 |
Source: Public Records
Map
Nearby Homes
- 2402 Woodbridge Dr
- 2610 Chadwick Rd
- 2603 Chadwick Rd
- 4050 Idlewilde Meadows Dr NE
- 2578 Middle Coray Cir
- 4056 Longford Dr NE
- 2124 Lassiter Field Dr NE
- 4464 Windsor Oaks Dr
- 4259 Arbor Club Dr
- 4499 Browning Ct NE
- 2696 S Arbor Dr
- 3901 Hazelhurst Dr
- 3851 Trickum Rd NE
- 3816 Havenrock Dr
- 3812 Havenrock Dr
- 3844 Havenrock
- 2855 Lamer Trace
- 3835 Rockhaven Ct
- 3043 Sawyer Trace NE
- 3969 Devon Oaks Dr NE
- 3971 Devon Oaks Dr NE
- 3967 Devon Oaks Dr NE
- 4116 Devon Wood Dr NE
- 4118 Devon Wood Dr NE
- 3968 Devon Oaks Dr NE
- 3965 Devon Oaks Dr NE
- 4114 Devon Wood Dr NE
- 3973 Devon Oaks Dr NE
- 4120 Devon Wood Dr NE
- 3966 Devon Oaks Dr NE
- 4112 Devon Wood Dr NE
- 3975 Devon Oaks Dr NE
- 3976 Devon Oaks Dr NE
- 3963 Devon Oaks Dr NE
- 3977 Devon Oaks Dr NE
- 4110 Devon Wood Dr NE
- 4122 Devon Wood Dr NE
- 3979 Devon Oaks Dr NE
- 3961 Devon Oaks Dr NE