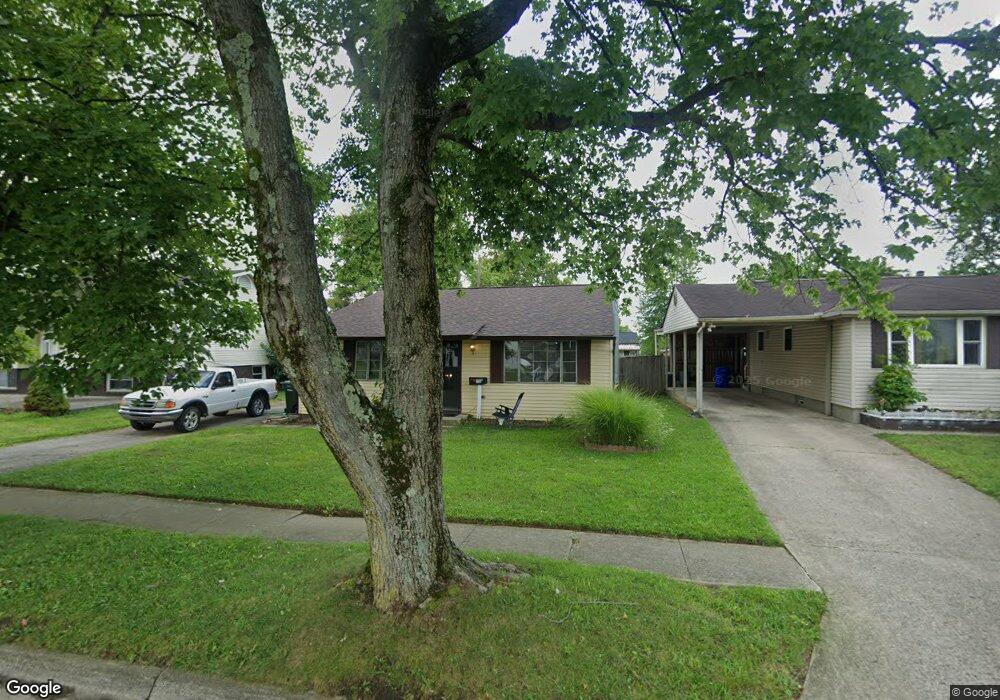
3969 Randell Rd Columbus, OH 43228
Holly Hill NeighborhoodEstimated Value: $163,000 - $184,000
3
Beds
1
Bath
864
Sq Ft
$203/Sq Ft
Est. Value
About This Home
This home is located at 3969 Randell Rd, Columbus, OH 43228 and is currently estimated at $174,975, approximately $202 per square foot. 3969 Randell Rd is a home located in Franklin County with nearby schools including Georgian Heights Alt Elementary School, Wedgewood Middle School, and Briggs High School.
Ownership History
Date
Name
Owned For
Owner Type
Purchase Details
Closed on
Aug 11, 2014
Sold by
Toner Patricia A and Thompson Margaret Ann
Bought by
Martin Jamie
Current Estimated Value
Home Financials for this Owner
Home Financials are based on the most recent Mortgage that was taken out on this home.
Original Mortgage
$50,000
Outstanding Balance
$34,413
Interest Rate
4.11%
Mortgage Type
Purchase Money Mortgage
Estimated Equity
$140,562
Purchase Details
Closed on
Sep 11, 2003
Sold by
Toner Patrick A
Bought by
Toner Patrick A and Thompson Margaret Ann
Home Financials for this Owner
Home Financials are based on the most recent Mortgage that was taken out on this home.
Original Mortgage
$60,000
Interest Rate
6.33%
Mortgage Type
Purchase Money Mortgage
Purchase Details
Closed on
Jun 26, 2003
Sold by
Toner Toner James Michael James Michael and Toner Thompson Margaret Ann
Bought by
Toner Patrick A and Thompson Margaret Ann
Purchase Details
Closed on
May 19, 2003
Sold by
Estate Of Michael John Toner Sr
Bought by
Toner Patrick A and Toner James Michael
Purchase Details
Closed on
Jul 25, 1990
Bought by
Toner Michael J
Create a Home Valuation Report for This Property
The Home Valuation Report is an in-depth analysis detailing your home's value as well as a comparison with similar homes in the area
Home Values in the Area
Average Home Value in this Area
Purchase History
| Date | Buyer | Sale Price | Title Company |
|---|---|---|---|
| Martin Jamie | $60,000 | None Available | |
| Toner Patrick A | -- | Peterson Title Agency Inc | |
| Toner Patrick A | -- | Peterson Title Agency Inc | |
| Toner Patrick A | -- | Peterson Title Agency Inc | |
| Toner Patrick A | -- | -- | |
| Toner Michael J | $60,000 | -- |
Source: Public Records
Mortgage History
| Date | Status | Borrower | Loan Amount |
|---|---|---|---|
| Open | Martin Jamie | $50,000 | |
| Previous Owner | Toner Patrick A | $60,000 |
Source: Public Records
Tax History Compared to Growth
Tax History
| Year | Tax Paid | Tax Assessment Tax Assessment Total Assessment is a certain percentage of the fair market value that is determined by local assessors to be the total taxable value of land and additions on the property. | Land | Improvement |
|---|---|---|---|---|
| 2024 | $2,485 | $55,380 | $15,370 | $40,010 |
| 2023 | $2,454 | $55,370 | $15,365 | $40,005 |
| 2022 | $1,556 | $30,000 | $5,880 | $24,120 |
| 2021 | $1,559 | $30,000 | $5,880 | $24,120 |
| 2020 | $1,561 | $30,000 | $5,880 | $24,120 |
| 2019 | $1,516 | $24,990 | $4,900 | $20,090 |
| 2018 | $756 | $24,990 | $4,900 | $20,090 |
| 2017 | $1,515 | $24,990 | $4,900 | $20,090 |
| 2016 | $1,628 | $24,570 | $4,480 | $20,090 |
| 2015 | $739 | $24,570 | $4,480 | $20,090 |
| 2014 | $1,523 | $24,570 | $4,480 | $20,090 |
| 2013 | $884 | $28,910 | $5,285 | $23,625 |
Source: Public Records
Map
Nearby Homes
- 3997 Briggs Rd
- 3874 Eakin Rd
- 4146 Sexton Dr
- 3727-3729 Briggs Rd
- 4190 Salem Dr
- 829 Crevis Ln
- 673 Roth Ave
- 4201 Sexton Dr
- 4212 Sexton Dr
- 3814 Clime Rd
- 4220 Atlanta Dr
- 756 Brixham Rd
- 3551 Glorious Rd
- 4459 Amwood St
- 695 Demorest Rd
- 781 Stephen Dr W
- 3728 Greenock Ct
- 4483 White Leaf Way
- 4518 Hall Rd
- 1243 Trevor Ct
- 3975 Randell Rd
- 3963 Randell Rd
- 3983 Randell Rd
- 3957 Randell Rd
- 3984 Lynward Rd
- 3978 Lynward Rd
- 3990 Lynward Rd
- 3972 Lynward Rd
- 3989 Randell Rd
- 3949 Randell Rd
- 3994 Lynward Rd
- 3970 Randell Rd
- 3964 Randell Rd
- 3964 Lynward Rd
- 3976 Randell Rd
- 3956 Randell Rd
- 4002 Lynward Rd
- 3943 Randell Rd
- 3995 Randell Rd
- 3984 Randell Rd