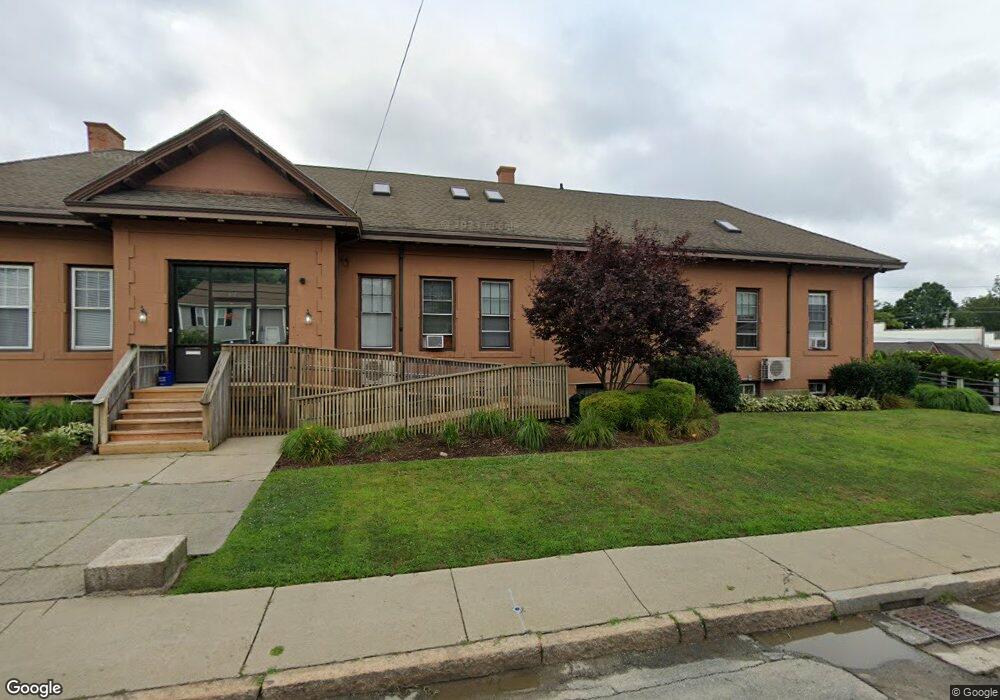
397 Bay St Fall River, MA 02724
Sandy Beach NeighborhoodEstimated Value: $1,116,410
Studio
3
Baths
10,093
Sq Ft
$111/Sq Ft
Est. Value
About This Home
This home is located at 397 Bay St, Fall River, MA 02724 and is currently estimated at $1,116,410, approximately $110 per square foot. 397 Bay St is a home located in Bristol County with nearby schools including Carlton M. Viveiros Elementary School, Matthew J. Kuss Middle School, and B M C Durfee High School.
Ownership History
Date
Name
Owned For
Owner Type
Purchase Details
Closed on
Mar 16, 2004
Sold by
Pelletier Linda Shipley
Bought by
Master Bldr Ministries
Current Estimated Value
Purchase Details
Closed on
Sep 8, 1995
Sold by
Martin Fnt and Martin Jamaes L
Bought by
Master Bldr Ministries
Create a Home Valuation Report for This Property
The Home Valuation Report is an in-depth analysis detailing your home's value as well as a comparison with similar homes in the area
Home Values in the Area
Average Home Value in this Area
Purchase History
| Date | Buyer | Sale Price | Title Company |
|---|---|---|---|
| Master Bldr Ministries | $530,000 | -- | |
| Master Bldr Ministries | $185,000 | -- |
Source: Public Records
Mortgage History
| Date | Status | Borrower | Loan Amount |
|---|---|---|---|
| Open | Master Bldr Ministries | $910,000 | |
| Previous Owner | Master Bldr Ministries | $340,000 | |
| Previous Owner | Master Bldr Ministries | $150,000 |
Source: Public Records
Tax History
| Year | Tax Paid | Tax Assessment Tax Assessment Total Assessment is a certain percentage of the fair market value that is determined by local assessors to be the total taxable value of land and additions on the property. | Land | Improvement |
|---|---|---|---|---|
| 2025 | -- | $716,900 | $156,200 | $560,700 |
| 2024 | -- | $706,200 | $148,700 | $557,500 |
| 2023 | $0 | $677,300 | $135,100 | $542,200 |
| 2022 | $0 | $677,300 | $135,100 | $542,200 |
| 2021 | $0 | $1,430,200 | $270,400 | $1,159,800 |
| 2020 | $0 | $1,408,900 | $283,000 | $1,125,900 |
| 2019 | $0 | $1,358,800 | $235,300 | $1,123,500 |
| 2018 | $0 | $1,348,700 | $231,100 | $1,117,600 |
| 2017 | -- | $1,348,700 | $231,100 | $1,117,600 |
| 2016 | -- | $1,348,700 | $231,100 | $1,117,600 |
| 2015 | -- | $1,348,700 | $231,100 | $1,117,600 |
| 2014 | -- | $1,348,700 | $231,100 | $1,117,600 |
Source: Public Records
Map
Nearby Homes
- 700 Shore Dr Unit 6-604
- 700 Shore Dr Unit 1205
- 700 Shore Dr Unit 810
- 70 Brown St
- 303 Eagle St Unit C
- 420 Bradford Ave
- 403 Division St Unit 13
- 403 Division St Unit 5
- 403 Division St Unit 9
- 403 Division St Unit 11
- 403 Division St Unit 12
- 403 Division St Unit 1
- 403 Division St Unit 18
- 20 Wilcox St
- 330 William St
- 334 Fountain St
- 1273-1279 S Main St
- 271 Mulberry St
- 1334 S Main St
- 169 Grant St
Your Personal Tour Guide
Ask me questions while you tour the home.