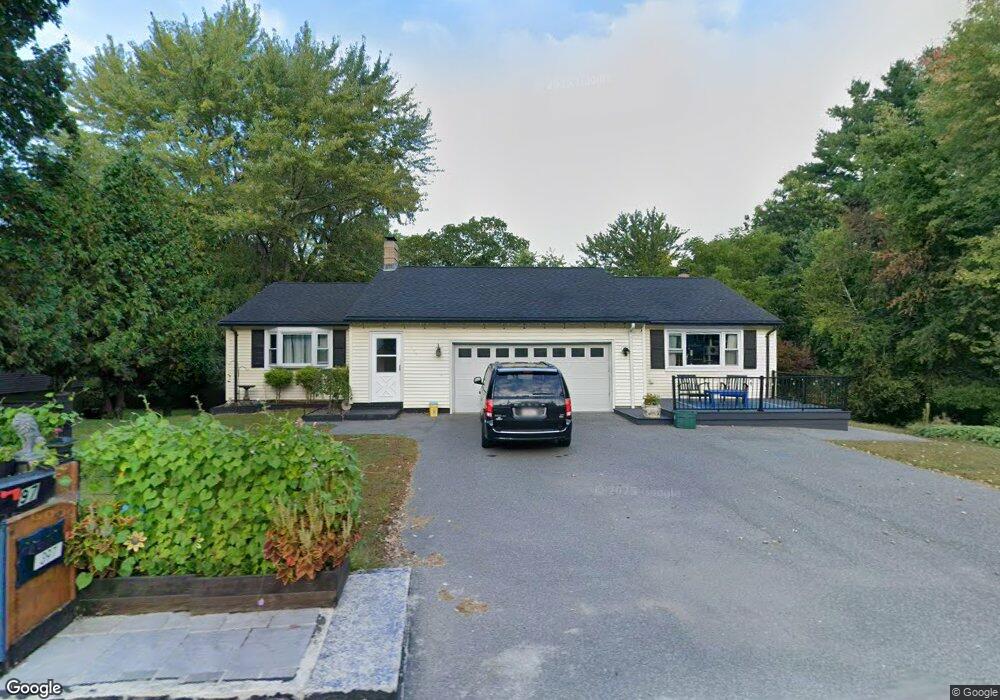
397 East St Easthampton, MA 01027
Estimated Value: $475,000 - $569,210
2
Beds
3
Baths
1,686
Sq Ft
$318/Sq Ft
Est. Value
About This Home
This home is located at 397 East St, Easthampton, MA 01027 and is currently estimated at $535,553, approximately $317 per square foot. 397 East St is a home located in Hampshire County with nearby schools including Easthampton High School, Hilltown Cooperative Charter Public School, and Tri-County Schools.
Ownership History
Date
Name
Owned For
Owner Type
Purchase Details
Closed on
Aug 25, 1995
Sold by
Gessing Henry W and Gessing Nancy A
Bought by
Favard Susan A
Current Estimated Value
Home Financials for this Owner
Home Financials are based on the most recent Mortgage that was taken out on this home.
Original Mortgage
$111,150
Interest Rate
7.32%
Mortgage Type
Purchase Money Mortgage
Create a Home Valuation Report for This Property
The Home Valuation Report is an in-depth analysis detailing your home's value as well as a comparison with similar homes in the area
Home Values in the Area
Average Home Value in this Area
Purchase History
| Date | Buyer | Sale Price | Title Company |
|---|---|---|---|
| Favard Susan A | $117,000 | -- |
Source: Public Records
Mortgage History
| Date | Status | Borrower | Loan Amount |
|---|---|---|---|
| Open | Favard Susan A | $48,500 | |
| Open | Favard Susan A | $107,500 | |
| Closed | Favard Susan A | $111,150 | |
| Previous Owner | Favard Susan A | $27,500 |
Source: Public Records
Tax History Compared to Growth
Tax History
| Year | Tax Paid | Tax Assessment Tax Assessment Total Assessment is a certain percentage of the fair market value that is determined by local assessors to be the total taxable value of land and additions on the property. | Land | Improvement |
|---|---|---|---|---|
| 2025 | $6,912 | $505,600 | $104,000 | $401,600 |
| 2024 | $6,676 | $492,300 | $101,000 | $391,300 |
| 2023 | $5,144 | $351,100 | $79,400 | $271,700 |
| 2022 | $5,804 | $351,100 | $79,400 | $271,700 |
| 2021 | $6,397 | $364,700 | $79,400 | $285,300 |
| 2020 | $6,236 | $351,100 | $79,400 | $271,700 |
| 2019 | $5,174 | $334,700 | $79,400 | $255,300 |
| 2018 | $4,931 | $308,200 | $74,800 | $233,400 |
| 2017 | $4,818 | $297,200 | $72,000 | $225,200 |
| 2016 | $4,633 | $297,200 | $72,000 | $225,200 |
| 2015 | $4,503 | $297,200 | $72,000 | $225,200 |
Source: Public Records
Map
Nearby Homes
- 108 Parsons St
- 78 Holyoke St
- 33 Knipfer Ave
- 98 Everett St
- 2 Clinton St
- 52-54 Everett St
- 12 Glen Cove Place Unit B
- 10 Glen Cove Place Unit A
- 52 Williston Ave
- 19 Nicols Way Unit 19
- 5 Lownds Ave
- 125 Park St
- 6 S St & Abutting Lots
- 38 West St
- 41 South St Unit 11
- 385 Main St
- 245 Park St
- 16 Bayberry Dr
- 4 Laurel Dr
- M143 &152 Glendale St