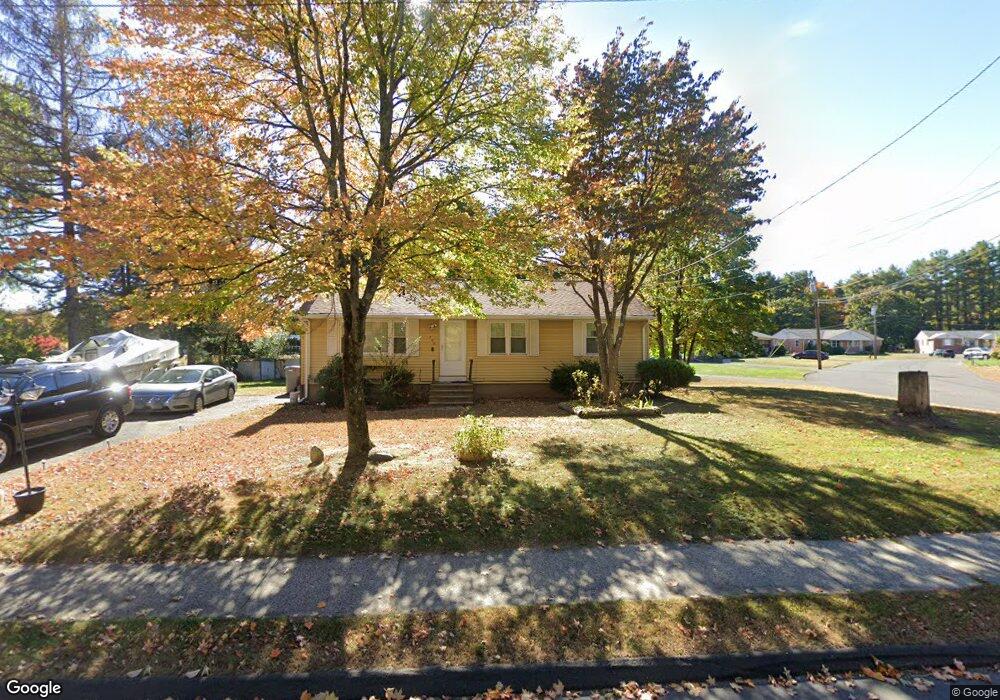
397 Mix St Bristol, CT 06010
North Bristol NeighborhoodEstimated Value: $311,000 - $341,000
3
Beds
2
Baths
1,092
Sq Ft
$295/Sq Ft
Est. Value
About This Home
This home is located at 397 Mix St, Bristol, CT 06010 and is currently estimated at $322,401, approximately $295 per square foot. 397 Mix St is a home located in Hartford County with nearby schools including Edgewood School, Chippens Hill Middle School, and Bristol Eastern High School.
Ownership History
Date
Name
Owned For
Owner Type
Purchase Details
Closed on
Oct 31, 2023
Sold by
Grant Eddie
Bought by
Grant Eddie
Current Estimated Value
Purchase Details
Closed on
May 22, 2000
Sold by
Larose Scott D
Bought by
Oursler Marianne
Home Financials for this Owner
Home Financials are based on the most recent Mortgage that was taken out on this home.
Original Mortgage
$55,920
Interest Rate
8.19%
Mortgage Type
Purchase Money Mortgage
Purchase Details
Closed on
Jan 4, 1974
Bought by
Grant Eddie W and Grant Josie M
Create a Home Valuation Report for This Property
The Home Valuation Report is an in-depth analysis detailing your home's value as well as a comparison with similar homes in the area
Home Values in the Area
Average Home Value in this Area
Purchase History
| Date | Buyer | Sale Price | Title Company |
|---|---|---|---|
| Grant Eddie | -- | None Available | |
| Oursler Marianne | $69,900 | -- | |
| Grant Eddie W | -- | -- |
Source: Public Records
Mortgage History
| Date | Status | Borrower | Loan Amount |
|---|---|---|---|
| Previous Owner | Grant Eddie W | $18,000 | |
| Previous Owner | Grant Eddie W | $55,920 |
Source: Public Records
Tax History Compared to Growth
Tax History
| Year | Tax Paid | Tax Assessment Tax Assessment Total Assessment is a certain percentage of the fair market value that is determined by local assessors to be the total taxable value of land and additions on the property. | Land | Improvement |
|---|---|---|---|---|
| 2025 | $4,997 | $148,050 | $39,690 | $108,360 |
| 2024 | $4,686 | $147,140 | $39,690 | $107,450 |
| 2023 | $4,466 | $147,140 | $39,690 | $107,450 |
| 2022 | $4,051 | $105,630 | $32,200 | $73,430 |
| 2021 | $4,051 | $105,630 | $32,200 | $73,430 |
| 2020 | $4,054 | $105,700 | $32,200 | $73,500 |
| 2019 | $4,022 | $105,700 | $32,200 | $73,500 |
| 2018 | $3,898 | $105,700 | $32,200 | $73,500 |
| 2017 | $3,748 | $104,020 | $40,040 | $63,980 |
| 2016 | $3,748 | $104,020 | $40,040 | $63,980 |
| 2015 | $3,600 | $104,020 | $40,040 | $63,980 |
| 2014 | $3,600 | $104,020 | $40,040 | $63,980 |
Source: Public Records
Map
Nearby Homes