397 N 3300 W Hurricane, UT 84737
Estimated Value: $506,000 - $524,000
5
Beds
3
Baths
2,091
Sq Ft
$248/Sq Ft
Est. Value
About This Home
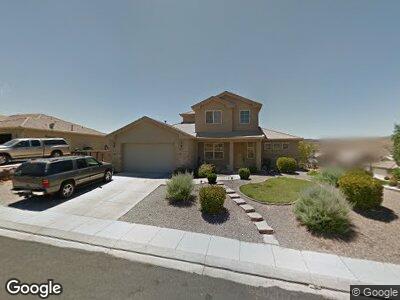
This home is located at 397 N 3300 W, Hurricane, UT 84737 and is currently estimated at $518,129, approximately $247 per square foot. 397 N 3300 W is a home located in Washington County with nearby schools including Hurricane Middle School, Hurricane High School, and Hurricane Intermediate School.
Ownership History
Date
Name
Owned For
Owner Type
Purchase Details
Closed on
Oct 25, 2005
Sold by
Randall Stewart Construction Llc
Bought by
Bills Daniel A and Billls Crystal D
Current Estimated Value
Home Financials for this Owner
Home Financials are based on the most recent Mortgage that was taken out on this home.
Original Mortgage
$212,698
Outstanding Balance
$120,754
Interest Rate
5.87%
Mortgage Type
Adjustable Rate Mortgage/ARM
Estimated Equity
$405,798
Purchase Details
Closed on
Mar 3, 2005
Sold by
Empey Alan M and Empey Dale W
Bought by
Randall Stewart Construction Llc
Home Financials for this Owner
Home Financials are based on the most recent Mortgage that was taken out on this home.
Original Mortgage
$187,000
Interest Rate
5.66%
Mortgage Type
Construction
Create a Home Valuation Report for This Property
The Home Valuation Report is an in-depth analysis detailing your home's value as well as a comparison with similar homes in the area
Home Values in the Area
Average Home Value in this Area
Purchase History
| Date | Buyer | Sale Price | Title Company |
|---|---|---|---|
| Bills Daniel A | -- | First American Title | |
| Randall Stewart Construction Llc | -- | First American Title Co |
Source: Public Records
Mortgage History
| Date | Status | Borrower | Loan Amount |
|---|---|---|---|
| Open | Bills Daniel A | $49,648 | |
| Closed | Bills Daniel A | $16,562 | |
| Open | Bills Daniel A | $212,698 | |
| Previous Owner | Randall Stewart Construction Llc | $187,000 |
Source: Public Records
Tax History Compared to Growth
Tax History
| Year | Tax Paid | Tax Assessment Tax Assessment Total Assessment is a certain percentage of the fair market value that is determined by local assessors to be the total taxable value of land and additions on the property. | Land | Improvement |
|---|---|---|---|---|
| 2023 | $1,982 | $265,870 | $63,250 | $202,620 |
| 2022 | $1,991 | $250,415 | $52,250 | $198,165 |
| 2021 | $1,812 | $336,800 | $65,000 | $271,800 |
| 2020 | $1,747 | $303,600 | $60,000 | $243,600 |
| 2019 | $1,765 | $297,500 | $60,000 | $237,500 |
| 2018 | $1,692 | $146,685 | $0 | $0 |
| 2017 | $1,616 | $134,750 | $0 | $0 |
| 2016 | $1,510 | $121,935 | $0 | $0 |
| 2015 | $1,518 | $118,085 | $0 | $0 |
| 2014 | $1,335 | $108,020 | $0 | $0 |
Source: Public Records
Map
Nearby Homes