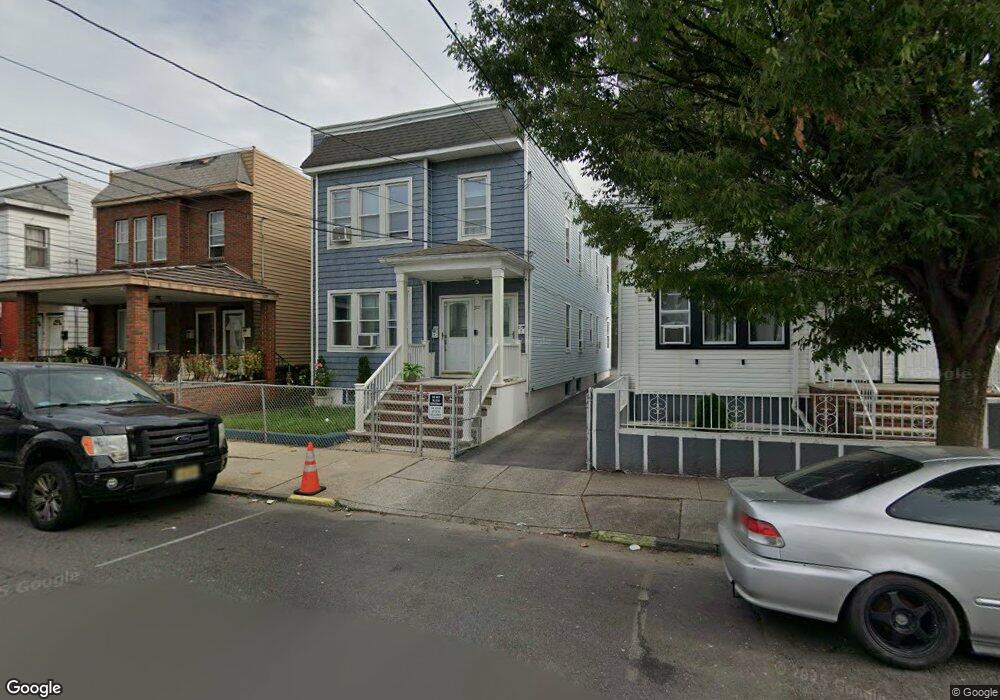
397 N 6th St Newark, NJ 07107
Lower Roseville NeighborhoodEstimated Value: $463,372 - $580,000
--
Bed
--
Bath
2,136
Sq Ft
$247/Sq Ft
Est. Value
About This Home
This home is located at 397 N 6th St, Newark, NJ 07107 and is currently estimated at $527,843, approximately $247 per square foot. 397 N 6th St is a home located in Essex County with nearby schools including Dr. William H. Horton School, First Avenue Elementary School, and Franklin School.
Ownership History
Date
Name
Owned For
Owner Type
Purchase Details
Closed on
Sep 15, 2022
Sold by
Velez Luis A and Velez Edna L
Bought by
Luna Edwin Benito Susan
Current Estimated Value
Home Financials for this Owner
Home Financials are based on the most recent Mortgage that was taken out on this home.
Original Mortgage
$440,867
Outstanding Balance
$420,304
Interest Rate
4.99%
Mortgage Type
FHA
Estimated Equity
$107,539
Purchase Details
Closed on
Dec 18, 1984
Bought by
Velez Luis and Velez Edna
Create a Home Valuation Report for This Property
The Home Valuation Report is an in-depth analysis detailing your home's value as well as a comparison with similar homes in the area
Home Values in the Area
Average Home Value in this Area
Purchase History
| Date | Buyer | Sale Price | Title Company |
|---|---|---|---|
| Luna Edwin Benito Susan | $449,000 | Advanced Title & Abstract | |
| Velez Luis | $41,500 | -- |
Source: Public Records
Mortgage History
| Date | Status | Borrower | Loan Amount |
|---|---|---|---|
| Open | Luna Edwin Benito Susan | $440,867 |
Source: Public Records
Tax History Compared to Growth
Tax History
| Year | Tax Paid | Tax Assessment Tax Assessment Total Assessment is a certain percentage of the fair market value that is determined by local assessors to be the total taxable value of land and additions on the property. | Land | Improvement |
|---|---|---|---|---|
| 2025 | $5,201 | $139,500 | $27,300 | $112,200 |
| 2024 | $5,201 | $139,500 | $27,300 | $112,200 |
| 2022 | $5,212 | $139,500 | $27,300 | $112,200 |
| 2021 | $5,209 | $139,500 | $27,300 | $112,200 |
| 2020 | $5,301 | $139,500 | $27,300 | $112,200 |
| 2019 | $5,247 | $139,500 | $27,300 | $112,200 |
| 2018 | $5,152 | $139,500 | $27,300 | $112,200 |
| 2017 | $4,966 | $139,500 | $27,300 | $112,200 |
| 2016 | $4,799 | $139,500 | $27,300 | $112,200 |
| 2015 | $4,616 | $139,500 | $27,300 | $112,200 |
| 2014 | $4,326 | $139,500 | $27,300 | $112,200 |
Source: Public Records
Map
Nearby Homes
- 382-384 N 7th St
- 372 N 7th St
- 352 N 7th St
- 362 N 6th St
- 323 N 7th St
- 349 N 5th St
- 347 N 5th St Unit 349
- 318 N 7th St
- 457 N 7th St
- 226 N 9th St
- 277 2nd Ave W Unit 2
- 277 2nd Ave W
- 166 N 9th St Unit 3
- 504 N 7th St Unit 506
- 504-506 N 7th St
- 261 Lake St
- 248 N 7th St Unit 248
- 126 Highland Ave
- 118 N 9th St Unit 120
- 118-120 N 9th St
- 397 N 6th St Unit 2
- 399 N 6th St
- 395 N 6th St
- 393 N 6th St
- 401 N 6th St
- 403 N 6th St
- 391 N 6th St
- 405 N 6th St
- 389 N 6th St
- 402 N 5th St Unit 404
- 387 N 6th St
- 407 N 6th St
- 398 N 6th St
- 396 N 6th St
- 400-402 N 6th St
- 400 N 5th St
- 392 N 6th St Unit 394
- 404 N 6th St Unit A
- 404 N 6th St Unit A
- 404 N 6th St Unit B