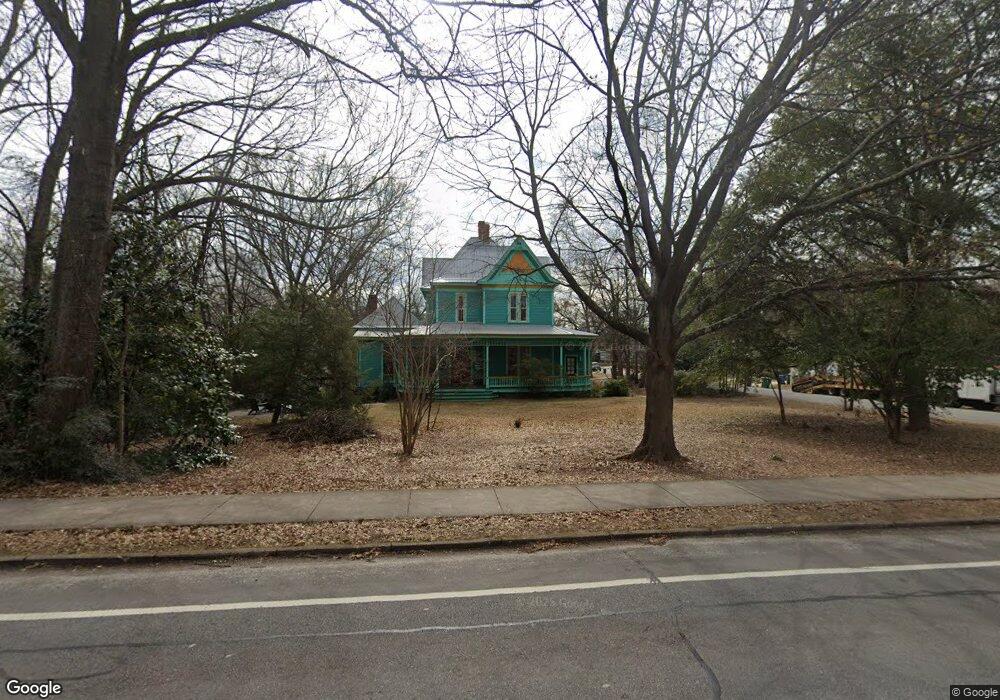
397 Oglethorpe Ave Athens, GA 30606
Normaltown NeighborhoodEstimated Value: $795,000 - $1,058,000
6
Beds
4
Baths
3,590
Sq Ft
$259/Sq Ft
Est. Value
About This Home
This home is located at 397 Oglethorpe Ave, Athens, GA 30606 and is currently estimated at $929,749, approximately $258 per square foot. 397 Oglethorpe Ave is a home located in Clarke County with nearby schools including Johnnie Lay Burks Elementary School, Clarke Middle School, and Clarke Central High School.
Ownership History
Date
Name
Owned For
Owner Type
Purchase Details
Closed on
Apr 15, 2016
Sold by
Hicks Matthew T
Bought by
Zobot Properties Llc
Current Estimated Value
Home Financials for this Owner
Home Financials are based on the most recent Mortgage that was taken out on this home.
Original Mortgage
$337,463
Interest Rate
3.73%
Mortgage Type
Commercial
Purchase Details
Closed on
Oct 1, 2007
Sold by
Not Provided
Bought by
Hicks Matthew T
Purchase Details
Closed on
Jun 26, 2006
Sold by
Not Provided
Bought by
Hicks Matthew T
Purchase Details
Closed on
Aug 30, 2000
Sold by
Northrop Phillip H and Northrop David A
Bought by
Stewart Robert B
Purchase Details
Closed on
Aug 8, 1996
Sold by
Loren Patina
Bought by
Northrop Phillip H and Lemack David A
Purchase Details
Closed on
Jun 22, 1989
Sold by
Wilson Christopher C and Wilson Katharina
Bought by
Loren Patina
Create a Home Valuation Report for This Property
The Home Valuation Report is an in-depth analysis detailing your home's value as well as a comparison with similar homes in the area
Home Values in the Area
Average Home Value in this Area
Purchase History
| Date | Buyer | Sale Price | Title Company |
|---|---|---|---|
| Zobot Properties Llc | $420,000 | -- | |
| Hicks Matthew T | $125,000 | -- | |
| Hicks Matthew T | $327,000 | -- | |
| Stewart Robert B | $248,000 | -- | |
| Northrop Phillip H | $190,000 | -- | |
| Loren Patina | $150,000 | -- |
Source: Public Records
Mortgage History
| Date | Status | Borrower | Loan Amount |
|---|---|---|---|
| Closed | Zobot Properties Llc | $337,463 |
Source: Public Records
Tax History
| Year | Tax Paid | Tax Assessment Tax Assessment Total Assessment is a certain percentage of the fair market value that is determined by local assessors to be the total taxable value of land and additions on the property. | Land | Improvement |
|---|---|---|---|---|
| 2025 | $10,806 | $348,016 | $40,800 | $307,216 |
| 2024 | $10,806 | $314,486 | $40,800 | $273,686 |
| 2023 | $9,828 | $292,755 | $40,800 | $251,955 |
| 2022 | $7,207 | $225,915 | $40,800 | $185,115 |
| 2021 | $6,889 | $204,433 | $36,720 | $167,713 |
| 2020 | $6,436 | $190,978 | $36,720 | $154,258 |
| 2019 | $6,178 | $181,974 | $30,600 | $151,374 |
| 2018 | $5,950 | $175,246 | $30,600 | $144,646 |
| 2017 | $5,704 | $169,480 | $30,600 | $138,880 |
| 2016 | $4,989 | $146,944 | $30,600 | $116,344 |
| 2015 | $4,329 | $127,317 | $22,440 | $104,877 |
| 2014 | $4,258 | $125,038 | $22,440 | $102,598 |
Source: Public Records
Map
Nearby Homes
- 375 Best Dr
- 663 Oglethorpe Ave
- 159 Sylvia Cir
- 282 Holman Ave
- 271 King Ave
- 215 Holman Ave
- 923 Hill St
- 145 Sunset Dr
- 970 Oglethorpe Ave
- 552 Cobb St
- 480 N Billups St
- 342 Knottingham Dr
- 947 N Chase St
- 1196 W Hancock Ave Unit 1
- 1198 W West Hancock Ave W
- 110 Valley St
- 105 Magnolia Terrace
- 524 Hill St
- 1080 Oglethorpe Ave
- 1226 W Broad St
- 355 Oglethorpe Ave
- 370 Willow Run
- 411 Oglethorpe Ave
- 425 Willow Run
- 347 Oglethorpe Ave
- 425 Oglethorpe Ave
- 382 Sanders Ct
- 360 Willow Run
- 210 Oglethorpe Terrace
- 220 Oglethorpe Terrace
- 447 Oglethorpe Ave
- 350 Willow Run
- 327 Oglethorpe Ave Unit 2
- 327 Oglethorpe Ave
- 449 Oglethorpe Ave
- 170 Normal Ave
- 172 Normal Ave
- 180 Normal Ave
- 455 Oglethorpe Ave
- 240 Oglethorpe Terrace
Your Personal Tour Guide
Ask me questions while you tour the home.