Estimated Value: $511,000 - $649,000
4
Beds
3
Baths
3,080
Sq Ft
$189/Sq Ft
Est. Value
About This Home
This home is located at 397 Old Petersham Rd, Barre, MA 01005 and is currently estimated at $582,954, approximately $189 per square foot. 397 Old Petersham Rd is a home located in Worcester County with nearby schools including Quabbin Regional Middle School and Quabbin Regional High School.
Ownership History
Date
Name
Owned For
Owner Type
Purchase Details
Closed on
Jan 6, 2022
Sold by
Surprenant Mark J and Surprenant Julie M
Bought by
Surprenant Lt and Surprenant
Current Estimated Value
Purchase Details
Closed on
Sep 17, 2012
Sold by
Surprenant Julie M
Bought by
Surprenant Mark M and Surprenant Julie M
Home Financials for this Owner
Home Financials are based on the most recent Mortgage that was taken out on this home.
Original Mortgage
$290,000
Interest Rate
3.57%
Mortgage Type
New Conventional
Purchase Details
Closed on
Jul 29, 2008
Sold by
Barnes Lt and Barnes
Bought by
Barnes-Suprenant Julie M
Create a Home Valuation Report for This Property
The Home Valuation Report is an in-depth analysis detailing your home's value as well as a comparison with similar homes in the area
Home Values in the Area
Average Home Value in this Area
Purchase History
| Date | Buyer | Sale Price | Title Company |
|---|---|---|---|
| Surprenant Lt | -- | None Available | |
| Surprenant Lt | -- | None Available | |
| Surprenant Mark M | -- | -- | |
| Surprenant Mark M | -- | -- | |
| Surprenant Mark M | -- | -- | |
| Barnes-Suprenant Julie M | -- | -- | |
| Barnes-Suprenant Julie M | -- | -- | |
| Barnes-Suprenant Julie M | -- | -- |
Source: Public Records
Mortgage History
| Date | Status | Borrower | Loan Amount |
|---|---|---|---|
| Previous Owner | Surprenant Mark M | $290,000 | |
| Previous Owner | Barnes-Suprenant Julie M | $301,500 |
Source: Public Records
Tax History Compared to Growth
Tax History
| Year | Tax Paid | Tax Assessment Tax Assessment Total Assessment is a certain percentage of the fair market value that is determined by local assessors to be the total taxable value of land and additions on the property. | Land | Improvement |
|---|---|---|---|---|
| 2025 | $8,168 | $601,000 | $61,100 | $539,900 |
| 2024 | $8,101 | $579,500 | $57,600 | $521,900 |
| 2023 | $7,240 | $456,500 | $45,600 | $410,900 |
| 2022 | $7,421 | $440,700 | $39,200 | $401,500 |
| 2021 | $7,027 | $390,400 | $39,200 | $351,200 |
| 2020 | $6,744 | $377,400 | $39,200 | $338,200 |
| 2019 | $6,730 | $371,400 | $35,800 | $335,600 |
| 2018 | $6,580 | $350,000 | $35,800 | $314,200 |
| 2017 | $6,412 | $342,900 | $35,800 | $307,100 |
| 2016 | $5,979 | $335,900 | $32,400 | $303,500 |
| 2015 | $5,928 | $318,000 | $39,500 | $278,500 |
| 2014 | $5,020 | $312,600 | $46,400 | $266,200 |
Source: Public Records
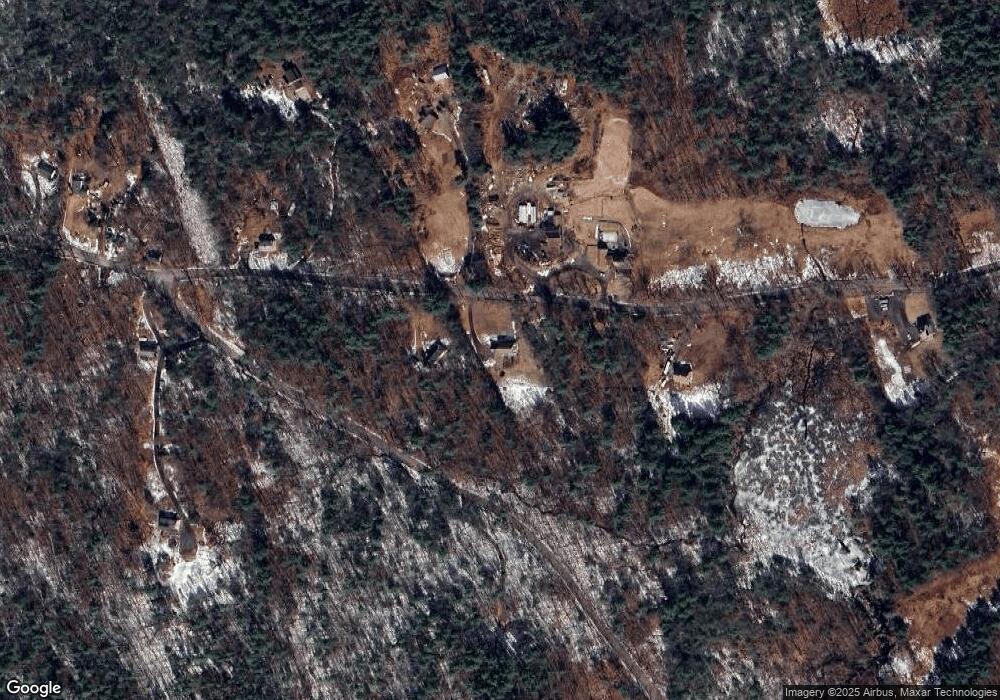
Map
Nearby Homes
- 417 Old Petersham Rd
- 382 Old Petersham Rd
- 351 Old Petersham Rd
- 400 Old Petersham Rd
- 480 Old Petersham Rd
- 112 Gilbert Rd
- 458 Old Petersham Rd
- 2 Gilbert Rd
- 520 Old Petersham Rd
- 315 Old Petersham Rd
- 538 Old Petersham Rd
- 560 Old Petersham Rd
- 221 Phillipston Rd
- 0 Old Petersham Rd
- 211 Phillipston Rd
- 121 Phillipston Rd
- 0 Phillipston Rd
- 299 Phillipston Rd
- 199 Phillipston Rd
- 252 Phillipston Rd