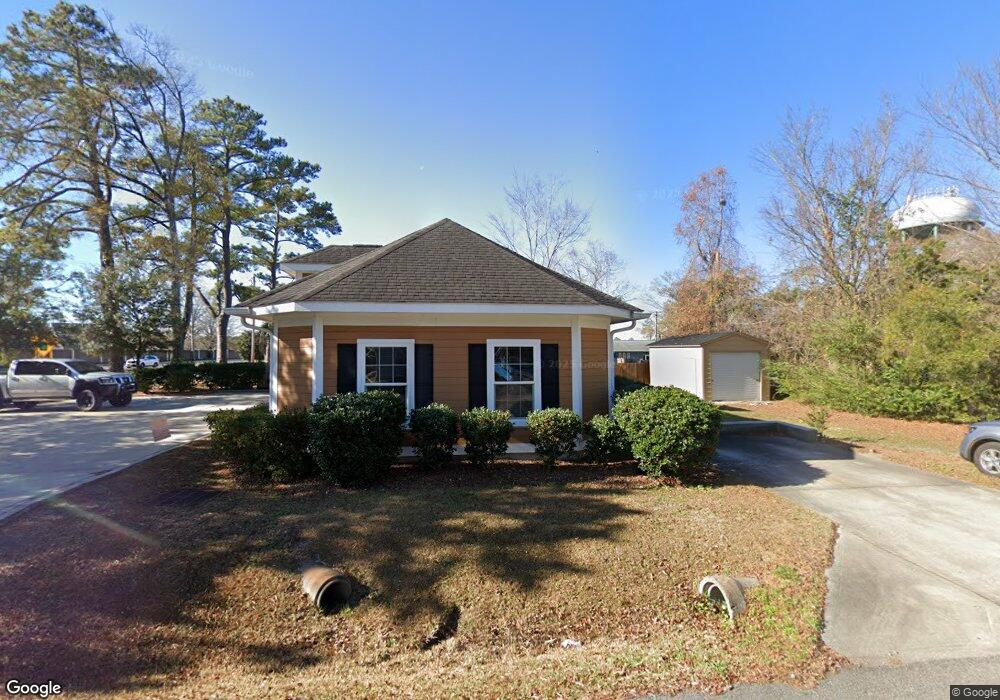
397 Robert M Grissom Pkwy Myrtle Beach, SC 29577
Downtown Myrtle Beach NeighborhoodEstimated Value: $391,831
--
Bed
--
Bath
1,562
Sq Ft
$251/Sq Ft
Est. Value
About This Home
This home is located at 397 Robert M Grissom Pkwy, Myrtle Beach, SC 29577 and is currently estimated at $391,831, approximately $250 per square foot. 397 Robert M Grissom Pkwy is a home located in Horry County with nearby schools including Myrtle Beach Child Development Center, Myrtle Beach Primary School, and Myrtle Beach Elementary School.
Ownership History
Date
Name
Owned For
Owner Type
Purchase Details
Closed on
Jan 24, 2024
Sold by
Lynch Barbara A
Bought by
Duo Barbershop And Salon Llc
Current Estimated Value
Purchase Details
Closed on
Mar 14, 2022
Sold by
R Reynolds Properties Llc
Bought by
Lynch Barbara A
Purchase Details
Closed on
Apr 29, 2008
Sold by
Palmetto Properties Of Myrtle Beach Inc
Bought by
R Reynolds Properties Llc
Home Financials for this Owner
Home Financials are based on the most recent Mortgage that was taken out on this home.
Original Mortgage
$250,000
Interest Rate
5.86%
Mortgage Type
Construction
Purchase Details
Closed on
Apr 26, 2006
Sold by
Fortune Ward Mary L and Fortune Ward Mary Louise
Bought by
Palmetto Properties Of Myrtle Beach Inc
Purchase Details
Closed on
Feb 28, 2006
Sold by
Ward Mary Louise Fortune and Estate Of Waites James Ward
Bought by
Ward Mary Louise Fortune
Create a Home Valuation Report for This Property
The Home Valuation Report is an in-depth analysis detailing your home's value as well as a comparison with similar homes in the area
Home Values in the Area
Average Home Value in this Area
Purchase History
| Date | Buyer | Sale Price | Title Company |
|---|---|---|---|
| Duo Barbershop And Salon Llc | -- | -- | |
| Lynch Barbara A | $349,000 | -- | |
| R Reynolds Properties Llc | $125,000 | -- | |
| Palmetto Properties Of Myrtle Beach Inc | $83,000 | None Available | |
| Ward Mary Louise Fortune | -- | None Available |
Source: Public Records
Mortgage History
| Date | Status | Borrower | Loan Amount |
|---|---|---|---|
| Previous Owner | R Reynolds Properties Llc | $250,000 |
Source: Public Records
Tax History Compared to Growth
Tax History
| Year | Tax Paid | Tax Assessment Tax Assessment Total Assessment is a certain percentage of the fair market value that is determined by local assessors to be the total taxable value of land and additions on the property. | Land | Improvement |
|---|---|---|---|---|
| 2024 | $6,520 | $25,607 | $5,724 | $19,883 |
| 2023 | $6,131 | $12,873 | $2,926 | $9,947 |
| 2021 | $3,477 | $17,712 | $3,816 | $13,896 |
| 2020 | $3,317 | $17,712 | $3,816 | $13,896 |
| 2019 | $3,252 | $17,538 | $3,816 | $13,722 |
| 2018 | $0 | $10,974 | $2,544 | $8,430 |
| 2017 | $2,885 | $10,974 | $2,544 | $8,430 |
| 2016 | -- | $10,974 | $2,544 | $8,430 |
| 2015 | $2,852 | $10,974 | $2,544 | $8,430 |
| 2014 | $2,773 | $10,974 | $2,544 | $8,430 |
Source: Public Records
Map
Nearby Homes
- 1603 Stuart Square Cir
- 1636 Stuart Square Cir
- 1654 Low Country Place Unit C
- 1745 Low Country Place Unit D
- 0000 Racepath St
- 1805 Low Country Place Unit D
- 1900 Highway 501 Unit Lot 3 - 2.07 Acres
- 1377 E Highway 501
- 665 Martin St
- 1221 Alberta Dr
- 850 Maxine Ct Unit 5B
- 1303 Highway 15
- 1208 Pinegrove Dr Unit G
- 1208 Pinegrove Dr Unit D
- 1210 Pinegrove Dr Unit G
- 1405 Highway 15
- 1504 Highway 15 Unit Lot 32
- 128 Hoffman Park Dr
- 128 Hoffman Park Dr Unit 3
- 1207 Pinegrove Dr Unit C
- 391 Robert M Grissom Pkwy
- 411 Robert M Grissom Pkwy
- 411 Robert Grissom Pkwy
- 1501 Delos Dr
- 1505 Delos Dr
- 381 Robert M Grissom Pkwy
- 421 Robert M Grissom Pkwy
- 1604 Stuart Square Cir
- 1602 Stuart Square Cir Unit Stuart Square
- 1606 Stuart Square Cir
- 1602 Stuart Square Cir
- 1600 Stuart Square Cir
- 1662 Stuart Square Cir
- 1517 Delos Dr
- 1608 Stuart Square Cir
- 431 Robert M Grissom Pkwy
- 1660 Stuart Square Cir
- 1664 Stuart Square Cir Unit Stuart Square
- 1664 Stuart Square Cir
- 1329 Stalvey Ave