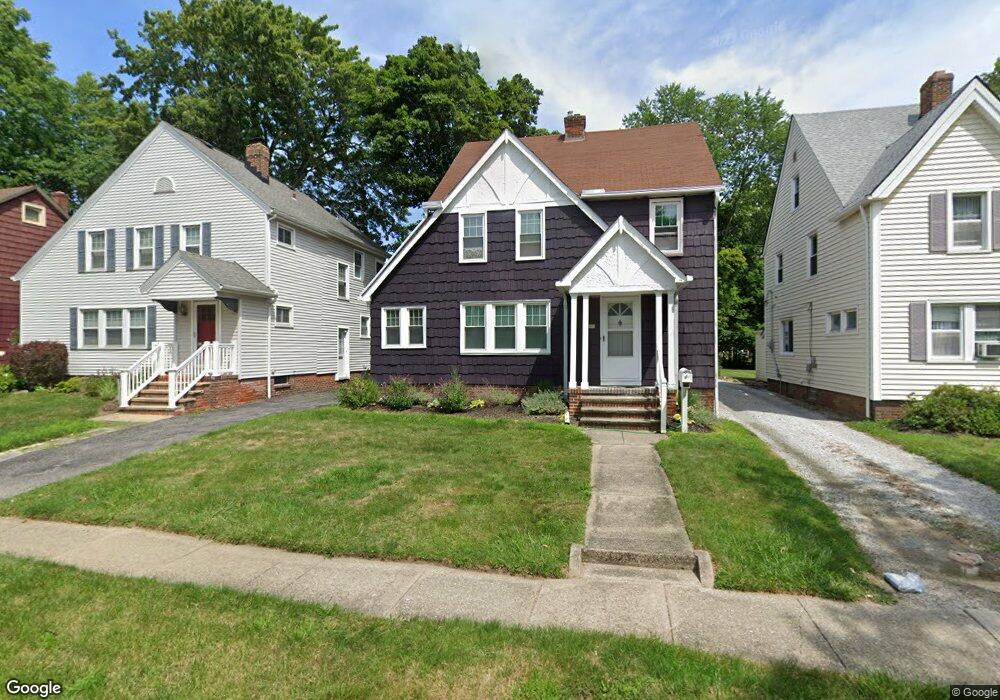
3971 Ardmore Rd Cleveland, OH 44121
Monticello-Noble NeighborhoodEstimated Value: $158,000 - $179,000
4
Beds
3
Baths
1,551
Sq Ft
$109/Sq Ft
Est. Value
About This Home
This home is located at 3971 Ardmore Rd, Cleveland, OH 44121 and is currently estimated at $169,054, approximately $108 per square foot. 3971 Ardmore Rd is a home located in Cuyahoga County with nearby schools including Noble Elementary School, Monticello Middle School, and Cleveland Heights High School.
Ownership History
Date
Name
Owned For
Owner Type
Purchase Details
Closed on
Sep 15, 2008
Sold by
Ettinger Marsha and Gerstenfeld Morris O
Bought by
Crosby Renaul O
Current Estimated Value
Home Financials for this Owner
Home Financials are based on the most recent Mortgage that was taken out on this home.
Original Mortgage
$74,348
Outstanding Balance
$49,499
Interest Rate
6.54%
Mortgage Type
FHA
Estimated Equity
$119,555
Purchase Details
Closed on
Apr 6, 2004
Sold by
Ettinger Marsha and Gerstenfeld Morris
Bought by
Ettinger Morris and Ettinger Marsha
Purchase Details
Closed on
Jun 28, 1990
Sold by
Morris O Gerstenfeld
Bought by
Gerstenfeld Marsha
Purchase Details
Closed on
Jun 30, 1982
Sold by
Gerstenfeld Morris O
Bought by
Morris O Gerstenfeld
Purchase Details
Closed on
Apr 6, 1978
Sold by
Smith Zara A
Bought by
Gerstenfeld Morris O
Purchase Details
Closed on
Jan 1, 1975
Bought by
Smith Zara A
Create a Home Valuation Report for This Property
The Home Valuation Report is an in-depth analysis detailing your home's value as well as a comparison with similar homes in the area
Home Values in the Area
Average Home Value in this Area
Purchase History
| Date | Buyer | Sale Price | Title Company |
|---|---|---|---|
| Crosby Renaul O | $50,140 | Real Living Title Agency Ltd | |
| Ettinger Morris | -- | -- | |
| Gerstenfeld Marsha | -- | -- | |
| Morris O Gerstenfeld | -- | -- | |
| Gerstenfeld Morris O | $31,100 | -- | |
| Smith Zara A | -- | -- |
Source: Public Records
Mortgage History
| Date | Status | Borrower | Loan Amount |
|---|---|---|---|
| Open | Crosby Renaul O | $74,348 |
Source: Public Records
Tax History Compared to Growth
Tax History
| Year | Tax Paid | Tax Assessment Tax Assessment Total Assessment is a certain percentage of the fair market value that is determined by local assessors to be the total taxable value of land and additions on the property. | Land | Improvement |
|---|---|---|---|---|
| 2024 | $4,553 | $53,480 | $9,205 | $44,275 |
| 2023 | $3,969 | $34,930 | $7,000 | $27,930 |
| 2022 | $3,801 | $34,930 | $7,000 | $27,930 |
| 2021 | $3,724 | $34,930 | $7,000 | $27,930 |
| 2020 | $3,711 | $31,470 | $6,300 | $25,170 |
| 2019 | $3,507 | $89,900 | $18,000 | $71,900 |
| 2018 | $3,576 | $31,470 | $6,300 | $25,170 |
| 2017 | $4,094 | $32,170 | $5,640 | $26,530 |
| 2016 | $3,840 | $32,170 | $5,640 | $26,530 |
| 2015 | $3,907 | $32,170 | $5,640 | $26,530 |
| 2014 | $3,907 | $34,590 | $6,060 | $28,530 |
Source: Public Records
Map
Nearby Homes
- 3983 Ardmore Rd
- 2884 Noble Rd
- 3983 Elmwood Rd
- 3861 Kirkwood Rd
- 1292 Plainfield Rd
- 1161 Pomona Rd
- 1157 Erieview Rd
- 1356 Plainfield Rd
- 1136 Erieview Rd
- 3821 Montevista Rd
- 3817 Montevista Rd
- 1148 Sylvania Rd
- 3844 Woodridge Rd
- 1271 Winston Rd
- 1231 Winston Rd
- 1268 Avondale Rd
- 3923 Orchard Rd
- 3837 Woodridge Rd
- 3821 Delmore Rd
- 1195 Oxford Rd
- 3975 Ardmore Rd
- 3967 Ardmore Rd
- 3959 Ardmore Rd
- 3968 Rosemond Rd
- 3972 Rosemond Rd
- 3966 Rosemond Rd
- 3953 Ardmore Rd
- 3960 Rosemond Rd
- 3956 Rosemond Rd
- 3980 Rosemond Rd
- 3951 Ardmore Rd
- 3989 Ardmore Rd
- 3964 Ardmore Rd
- 3968 Ardmore Rd
- 3960 Ardmore Rd
- 3972 Ardmore Rd
- 3952 Rosemond Rd
- 3986 Rosemond Rd
- 3947 Ardmore Rd
- 3978 Ardmore Rd