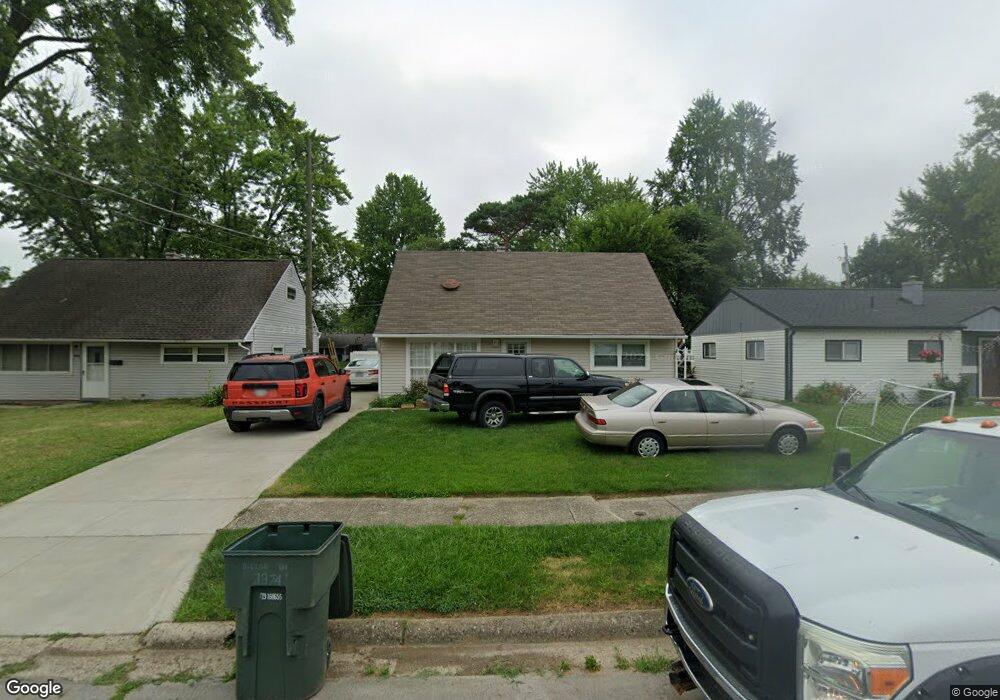
3974 Dillon Dr Columbus, OH 43227
Beechwood NeighborhoodEstimated Value: $173,000 - $241,000
4
Beds
2
Baths
1,207
Sq Ft
$174/Sq Ft
Est. Value
About This Home
This home is located at 3974 Dillon Dr, Columbus, OH 43227 and is currently estimated at $209,778, approximately $173 per square foot. 3974 Dillon Dr is a home located in Franklin County with nearby schools including Shady Lane Elementary School, Sherwood Middle School, and Walnut Ridge High School.
Ownership History
Date
Name
Owned For
Owner Type
Purchase Details
Closed on
Jul 26, 2021
Sold by
Estate Of Carol Henderson
Bought by
Henderson Deann Kaye
Current Estimated Value
Purchase Details
Closed on
Jul 27, 2010
Sold by
Suter David C
Bought by
Henderson Carol and Henderson Deann Kaye
Purchase Details
Closed on
Oct 7, 2009
Sold by
Aurora Loan Services Llc
Bought by
Suter David C
Purchase Details
Closed on
Sep 16, 2009
Sold by
Johnson Lisa and Tuvelle Mark
Bought by
Aurora Loan Services Llc
Purchase Details
Closed on
May 29, 2009
Sold by
Strip A C
Bought by
Aurora Loan Services Llc
Purchase Details
Closed on
Dec 15, 2006
Sold by
Bostic Mark S
Bought by
Johnson Lisa
Home Financials for this Owner
Home Financials are based on the most recent Mortgage that was taken out on this home.
Original Mortgage
$76,950
Interest Rate
7.25%
Mortgage Type
Purchase Money Mortgage
Purchase Details
Closed on
Apr 5, 2001
Sold by
Estate Of Harry L Archer
Bought by
Archer Betty
Purchase Details
Closed on
Jan 5, 1993
Purchase Details
Closed on
Sep 15, 1988
Create a Home Valuation Report for This Property
The Home Valuation Report is an in-depth analysis detailing your home's value as well as a comparison with similar homes in the area
Home Values in the Area
Average Home Value in this Area
Purchase History
| Date | Buyer | Sale Price | Title Company |
|---|---|---|---|
| Henderson Deann Kaye | -- | None Available | |
| Henderson Carol | $68,000 | Attorney | |
| Suter David C | $32,000 | Sovereign | |
| Aurora Loan Services Llc | $88,000 | None Available | |
| Aurora Loan Services Llc | $74,800 | Sovereign | |
| Johnson Lisa | $77,000 | Worthington | |
| Archer Betty | -- | -- | |
| -- | -- | -- | |
| -- | $47,900 | -- |
Source: Public Records
Mortgage History
| Date | Status | Borrower | Loan Amount |
|---|---|---|---|
| Previous Owner | Johnson Lisa | $76,950 |
Source: Public Records
Tax History
| Year | Tax Paid | Tax Assessment Tax Assessment Total Assessment is a certain percentage of the fair market value that is determined by local assessors to be the total taxable value of land and additions on the property. | Land | Improvement |
|---|---|---|---|---|
| 2025 | $2,765 | $58,630 | $14,460 | $44,170 |
| 2024 | $2,765 | $58,630 | $14,460 | $44,170 |
| 2023 | $2,602 | $58,625 | $14,455 | $44,170 |
| 2022 | $1,354 | $26,110 | $5,040 | $21,070 |
| 2021 | $1,357 | $26,110 | $5,040 | $21,070 |
| 2020 | $1,358 | $26,110 | $5,040 | $21,070 |
| 2019 | $1,247 | $20,550 | $4,030 | $16,520 |
| 2018 | $622 | $20,550 | $4,030 | $16,520 |
| 2017 | $1,246 | $20,550 | $4,030 | $16,520 |
| 2016 | $1,333 | $20,130 | $3,960 | $16,170 |
| 2015 | $605 | $20,130 | $3,960 | $16,170 |
| 2014 | $1,213 | $20,130 | $3,960 | $16,170 |
| 2013 | $705 | $23,695 | $4,655 | $19,040 |
Source: Public Records
Map
Nearby Homes
- 3955 E Fulton St
- 3990 Astor Ave
- 1265 Elderwood Ave
- 1251 Dellwood Ave
- 1035 E Fulton St
- 1001 Beechwood Rd
- 1002 Rose Place
- 1294 Dellwood Ave
- 931 E Fulton St
- 1269 Carolwood Ave
- 1116 Elaine Rd
- 1275 Elaine Rd
- 4024 Colby Ave
- 4111 Colby Ave
- 963 Erickson Ave
- 1370 Erickson Rd
- 1301 Bernhard Rd
- 3608 Bolton Ave
- 3598 Astor Ave
- 798 S Yearling Rd
- 3966 Dillon Dr
- 3980 Dillon Dr
- 3960 Dillon Dr
- 3984 Dillon Dr
- 3979 E Fulton St
- 3973 Dillon Dr
- 3987 E Fulton St
- 3971 E Fulton St
- 3952 Dillon Dr
- 3963 Dillon Dr
- 3995 E Fulton St
- 1132 Elderwood Ave
- 3957 Dillon Dr
- 3963 E Fulton St
- 1145 Elderwood Ave
- 3951 Dillon Dr
- 1138 Elderwood Ave
- 3944 Dillon Dr
- 4003 E Fulton St
- 1144 Elderwood Ave
Your Personal Tour Guide
Ask me questions while you tour the home.