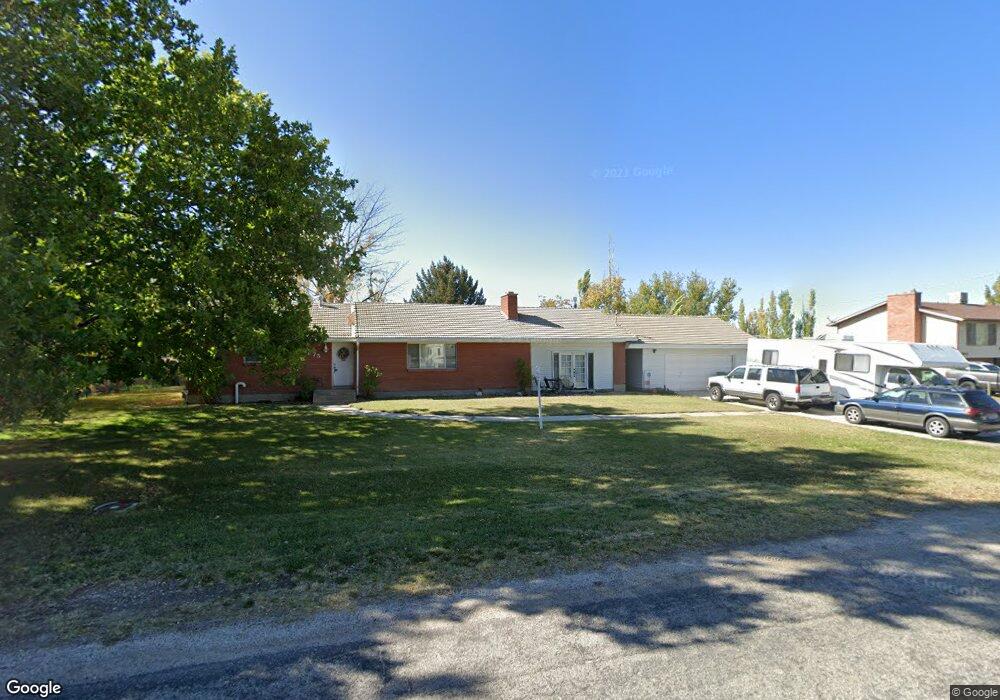
3975 S 5500 W Hooper, UT 84315
Estimated Value: $537,395 - $624,000
2
Beds
1
Bath
1,770
Sq Ft
$332/Sq Ft
Est. Value
About This Home
This home is located at 3975 S 5500 W, Hooper, UT 84315 and is currently estimated at $587,349, approximately $331 per square foot. 3975 S 5500 W is a home located in Weber County with nearby schools including Kanesville Elementary School, Rocky Mountain Junior High School, and Quest Academy.
Ownership History
Date
Name
Owned For
Owner Type
Purchase Details
Closed on
Sep 17, 2024
Sold by
Esplin Joy L and Watkins Joy L
Bought by
Watkins Joy L
Current Estimated Value
Home Financials for this Owner
Home Financials are based on the most recent Mortgage that was taken out on this home.
Original Mortgage
$114,000
Outstanding Balance
$104,167
Interest Rate
6.47%
Mortgage Type
New Conventional
Estimated Equity
$483,182
Purchase Details
Closed on
Feb 21, 2003
Sold by
Esplin Joy L
Bought by
Watkins Joy L
Home Financials for this Owner
Home Financials are based on the most recent Mortgage that was taken out on this home.
Original Mortgage
$159,500
Interest Rate
8.05%
Purchase Details
Closed on
Sep 29, 1998
Sold by
Esplin Gary D
Bought by
Esplin Joy L
Purchase Details
Closed on
Feb 21, 1996
Sold by
Patterson Dennis J and Patterson Judy G
Bought by
Esplin Gary D and Esplin Joy L
Home Financials for this Owner
Home Financials are based on the most recent Mortgage that was taken out on this home.
Original Mortgage
$133,743
Interest Rate
7.1%
Mortgage Type
FHA
Create a Home Valuation Report for This Property
The Home Valuation Report is an in-depth analysis detailing your home's value as well as a comparison with similar homes in the area
Home Values in the Area
Average Home Value in this Area
Purchase History
| Date | Buyer | Sale Price | Title Company |
|---|---|---|---|
| Watkins Joy L | -- | First American Title | |
| Watkins Joy L | -- | Inwest Title | |
| Esplin Joy L | -- | -- | |
| Esplin Gary D | -- | Mountain View Title |
Source: Public Records
Mortgage History
| Date | Status | Borrower | Loan Amount |
|---|---|---|---|
| Open | Watkins Joy L | $114,000 | |
| Previous Owner | Watkins Joy L | $159,500 | |
| Previous Owner | Esplin Gary D | $133,743 |
Source: Public Records
Tax History
| Year | Tax Paid | Tax Assessment Tax Assessment Total Assessment is a certain percentage of the fair market value that is determined by local assessors to be the total taxable value of land and additions on the property. | Land | Improvement |
|---|---|---|---|---|
| 2025 | $2,809 | $499,130 | $219,986 | $279,144 |
| 2024 | $2,712 | $270,049 | $120,992 | $149,057 |
| 2023 | $2,446 | $241,450 | $120,992 | $120,458 |
| 2022 | $2,550 | $257,400 | $107,250 | $150,150 |
| 2021 | $2,144 | $366,000 | $105,005 | $260,995 |
| 2020 | $2,019 | $316,000 | $90,008 | $225,992 |
| 2019 | $2,054 | $304,000 | $65,090 | $238,910 |
| 2018 | $1,850 | $262,000 | $65,090 | $196,910 |
| 2017 | $1,696 | $233,000 | $65,000 | $168,000 |
| 2016 | $1,538 | $114,241 | $27,500 | $86,741 |
| 2015 | $1,466 | $107,408 | $24,798 | $82,610 |
| 2014 | $1,363 | $97,263 | $24,798 | $72,465 |
Source: Public Records
Map
Nearby Homes
- 3842 S 5675 W
- 5478 W 3750 S
- 4111 S 5350 W
- 3691 S 5600 W Unit 20
- 3706 S 5650 W Unit 9
- 4129 S 5800 W Unit 4
- 4146 S 5800 W Unit 5
- 4194 S 5800 W Unit 14
- 4168 S 5800 W Unit 12
- 4179 S 5800 W Unit 1
- 4163 S 5800 W Unit 2
- 3561 S 5160 W
- 3245 S 4975 W Unit 13
- 3223 S 4975 W Unit 15
- 3257 S 4975 W Unit 12
- 3269 S 4975 W Unit 11
- 3233 S 4975 W Unit 14
- 3731 S 4975 W
- 3268 S 4950 W
- 3192 S 4950 W Unit 28
- 3955 S 5500 W
- 3976 S 5500 W
- 3930 S 5500 W
- 3905 S 5500 W
- 3912 S 5500 W
- 3951 S 5500 W
- 5500 W 4000 S
- 3962 S 5600 W Unit 16
- 3892 S 5500 W
- 4007 S 5500 W
- 3873 S 5500 W
- 3920 S 5600 W
- 3985 S 5600 W Unit MODEL
- 3985 S 5600 W
- 3944 S 5600 W
- 3870 S 5500 W
- 3880 S 5600 W Unit 12
- 4015 S 5500 W
- 3855 S 5500 W
- 3890 S 5600 W
Your Personal Tour Guide
Ask me questions while you tour the home.