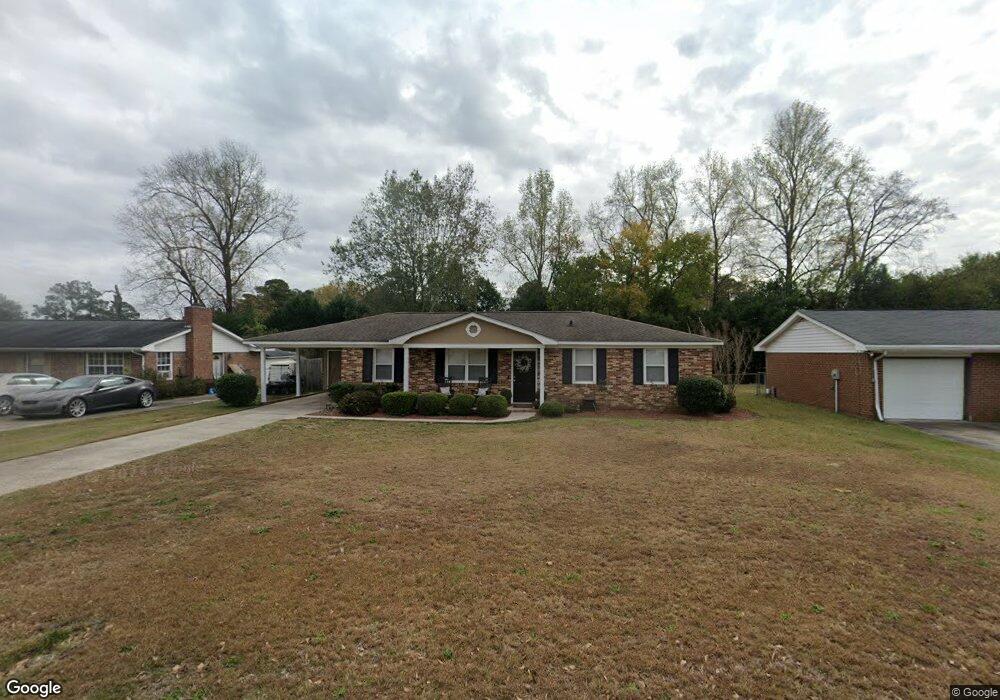
3976 Braddock St Augusta, GA 30907
Estimated Value: $210,000 - $225,304
3
Beds
2
Baths
1,311
Sq Ft
$165/Sq Ft
Est. Value
About This Home
This home is located at 3976 Braddock St, Augusta, GA 30907 and is currently estimated at $216,826, approximately $165 per square foot. 3976 Braddock St is a home located in Columbia County with nearby schools including Martinez Elementary School, Lakeside Middle School, and Lakeside High School.
Ownership History
Date
Name
Owned For
Owner Type
Purchase Details
Closed on
Sep 30, 2021
Sold by
Hutchins Nathaniel P
Bought by
Hutchins Robin H
Current Estimated Value
Purchase Details
Closed on
Nov 16, 2005
Sold by
Huckabee Brian
Bought by
Hutchins Nathaniel P and Hutchins Robin H
Home Financials for this Owner
Home Financials are based on the most recent Mortgage that was taken out on this home.
Original Mortgage
$69,600
Interest Rate
6.04%
Mortgage Type
New Conventional
Purchase Details
Closed on
Sep 6, 2005
Sold by
Cotton Kelly C
Bought by
Huckabee Brian
Purchase Details
Closed on
Jul 27, 2001
Sold by
Kolb Benny D
Bought by
Cotton Kelly C
Home Financials for this Owner
Home Financials are based on the most recent Mortgage that was taken out on this home.
Original Mortgage
$62,600
Interest Rate
7.37%
Create a Home Valuation Report for This Property
The Home Valuation Report is an in-depth analysis detailing your home's value as well as a comparison with similar homes in the area
Home Values in the Area
Average Home Value in this Area
Purchase History
| Date | Buyer | Sale Price | Title Company |
|---|---|---|---|
| Hutchins Robin H | -- | -- | |
| Hutchins Nathaniel P | $87,000 | -- | |
| Huckabee Brian | $76,900 | -- | |
| Cotton Kelly C | $78,300 | -- |
Source: Public Records
Mortgage History
| Date | Status | Borrower | Loan Amount |
|---|---|---|---|
| Previous Owner | Hutchins Nathaniel P | $69,600 | |
| Previous Owner | Hutchins Nathaniel P | $8,700 | |
| Previous Owner | Cotton Kelly C | $62,600 | |
| Closed | Cotton Kelly C | $11,725 |
Source: Public Records
Tax History
| Year | Tax Paid | Tax Assessment Tax Assessment Total Assessment is a certain percentage of the fair market value that is determined by local assessors to be the total taxable value of land and additions on the property. | Land | Improvement |
|---|---|---|---|---|
| 2025 | $2,119 | $88,335 | $17,604 | $70,731 |
| 2024 | $1,856 | $73,890 | $16,604 | $57,286 |
| 2023 | $1,856 | $67,328 | $13,904 | $53,424 |
| 2022 | $1,676 | $62,212 | $14,304 | $47,908 |
| 2021 | $1,566 | $55,433 | $11,604 | $43,829 |
| 2020 | $1,506 | $52,128 | $10,904 | $41,224 |
| 2019 | $1,477 | $51,063 | $10,504 | $40,559 |
| 2018 | $1,371 | $47,089 | $9,704 | $37,385 |
| 2017 | $1,377 | $47,145 | $9,204 | $37,941 |
| 2016 | $1,216 | $42,930 | $9,480 | $33,450 |
| 2015 | $1,170 | $41,134 | $9,380 | $31,754 |
| 2014 | $1,122 | $38,864 | $7,780 | $31,084 |
Source: Public Records
Map
Nearby Homes
- 3987 Braddock St
- 278 Maywood Dr
- 254 Hinman Dr
- 250 Hinman Dr
- 242 Maywood Dr
- 2818 Ferret Ct
- 3924 Old Trail Rd
- 3907 Willowood Rd
- 3927 Mack Rd
- 255 Settlement Rd
- 262 Indian Creek Rd
- 0 Settlement Rd
- 4067 Flintrock Way
- 207 Caribe Dr
- 409 Old Anderson Rd
- 270 Rose St
- 416 Old Anderson Rd
- 4170 Heathcliff Dr
- 3909 Roberts Rd
- 123 Lakeview Ct
- 3978 Braddock St
- 3974 Braddock St
- 3967 Old Trail Rd
- 3980 Braddock St
- 3965 Old Trail Rd
- 3972 Braddock St
- 3969 Old Trail Rd
- 3985 Braddock St
- 3963 Old Trail Rd
- 3983 Braddock St
- 3963 Old Trail Rd
- 3982 Braddock St
- 287 Hinman Dr
- 3989 Braddock St
- 3971 Old Trail Rd
- 3991 Braddock St
- 274 Hinman Dr
- 285 Hinman Dr
- 276 Hinman Dr
- 3973 Old Trail Rd
Your Personal Tour Guide
Ask me questions while you tour the home.